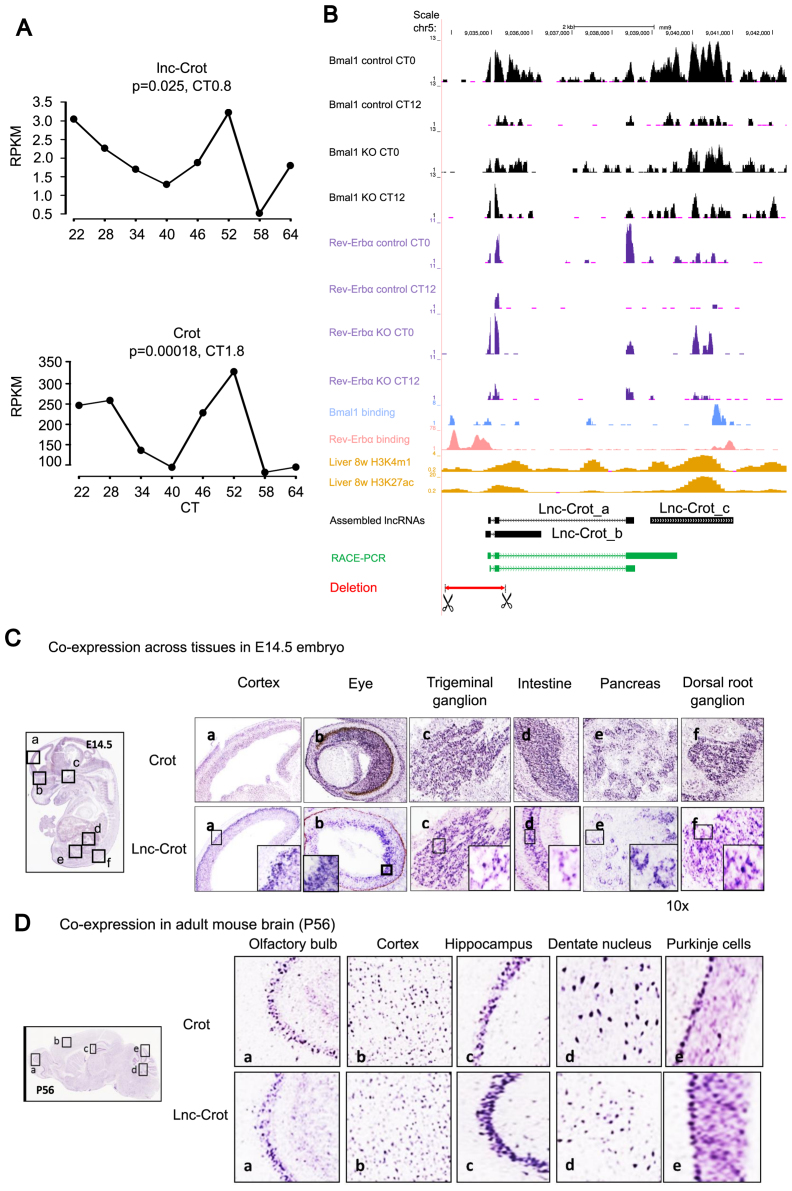
Figure 4.
Enhancer associated circadian lncRNA lnc-Crot and its co-expression with its neighboring gene Crot. (A) Circadian expression of lnc-Crot and its neighboring protein coding gene Crot in liver RNA-seq dataset 2. Significance of circadian oscillation and phase were calculated by cosine fitting method. (B) Lnc-Crot locus overlaps with enhancers and is bound by multiple transcription factors (TFs) as displayed by UCSC Genome Browser (mouse genome mm9) (http://genome.ucsc.edu). The tracks in black are RNA-seq of BMAL1 KO and control in liver and tracks in purple are RNA-seq of REV-ERBα KO and control in liver. BMAL1 binding (26,20), REV-ERBα binding (27,50) and histone marks were from ChIP-seq data in liver. Assembled gene models of three isoforms of lnc-Crot locus (lnc-Crot_a, lnc-Crot_b and lnc-Crot_c) were shown. Green track is the full-length gene model of lnc-Crot obtained by rapid amplification of cDNA ends (RACE)-PCR experiment. Red track is the deleted region of lnc-Crot by CRISPR-Cas9. (C) RNA-ISH of lnc-Crot and Crot across tissues in E14.5 mouse embryo (D) RNA-ISH of lnc-Crot and Crot across tissues in P56 adult mouse brain.

