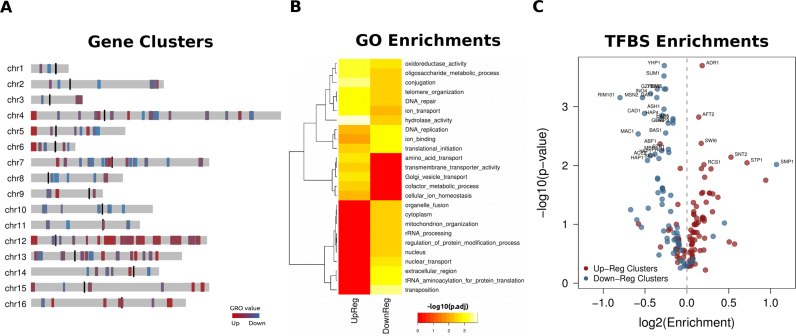
Figure 2.
Functional enrichment and regulatory modes in topologically co-regulated clusters. (A) Distribution of 116 topologically co-regulated gene clusters (TCGCs) in the yeast genome. (B) GO term enrichment heatmap of TCGCs of both types. Enrichments were calculated based on a modified Gene Set Enrichment Analysis (26). Only GO terms with an adjusted P-value ≤ 0.05 (at 5% FDR) for at least one of the two TCGCs types are reported. (C) Volcano plot showing enrichments of transcription factor binding sites (TFBS) for 102 different transcriptional regulators compiled by (27). Enrichments are shown as log2-based observed/expected ratios. Values >0 indicate enrichment and values <0 indicate depletion (see ‘Materials and Methods’ section). P-values correspond to 1000 permutations for each transcriptional regulator.

