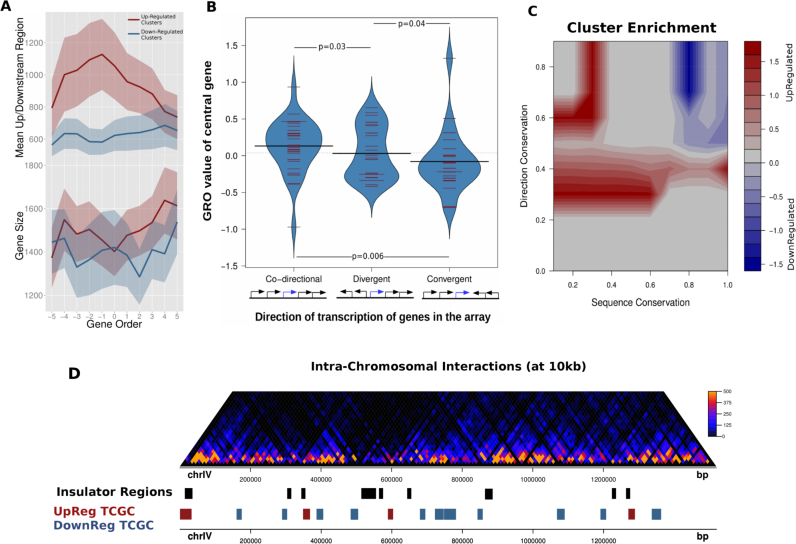
Figure 3.
Topologically co-regulated gene clusters share distinct preferences for intergenic space and transcription directionality. (A) Top: mean intergenic region length for clusters of 11 consecutive genes. Each line corresponds to the mean values calculated for the top/bottom 200 clusters based on the central 7 GRO values (see ‘Materials and Methods’ section for details). Bottom: same analysis for mean gene length. Shaded bands correspond to 95% confidence intervals. (B) Distribution of GRO values of genes lying in the center of five-gene clusters with different directionality patterns defined on the basis of transcriptional direction (N-co-directional = 36, N-divergent = 29, N-convergent = 25). P-values calculated on the basis of a Mann–Whitney U test. (C) Contour heatmap of enrichment of different types of TCGCs in areas of mean sequence conservation (as above, x-axis) and transcriptional direction index (y-axis), defined as the proportion of genes retaining relative gene position and directionality in two closely related species. Enrichments were calculated as log2-ratios of upregulated/downregulated clusters having values in a 10 × 10 value grid (see ‘Materials and Methods’ section). (D) Intra-chromosomal interactions map of chromosome IV and corresponding domains of insulation (black). Upregulated clusters (red) show a significantly increased tendency to be located in proximity to insulation regions, when compared to downregulated ones.

