Figure 3.
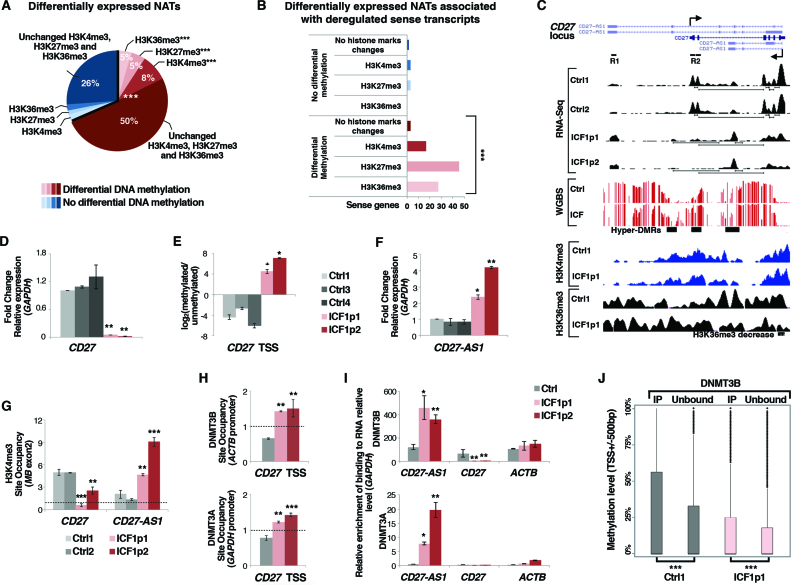
DNMT3B dysfunction affects sense-antisense pair genes transcription in ICF1 cells. (A) Pie chart showing the percentage of differentially expressed natural antisense transcripts (±500 bp) with at least 5 CpGs differentially methylated and/or H3K4me3, H3K27me3 and H3K36me3 marks changes, obtained by integrating the RNA-Seq, WGBS and ChIP-Seq datasets (P-values << 10−16 were calculated using one-tail hypergeometric test); (B) Differentially expressed sense genes associated with deregulated NATs are significantly enriched for DNA methylation and H3K4me3, H3K27me3 and H3K36me3 changes (P-values << 10−16 were calculated using one-tail hypergeometric test). The enrichment of histone modification changes in differentially methylated category compared to the unchanged methylation category was evaluated using χ2-test; (C) UCSC genome browser screenshots of CD27 gene showing the aberrant silencing of the sense transcript and the concomitant overexpression of the antisense transcript CD27-AS1 (RNA-Seq), the CpG methylation status (WGBS), and H3K4me3 and H3K36me3 enrichments (ChIP-Seq); (D) mRNA, and (E) CpG methylation level [log2 (methylated/unmethylated)] of CD27 sense gene; (F) mRNA level of CD27-AS1 antisense in ICF1 samples compared to controls (gene specific primers were used to detect exclusively the antisense transcript; Supplementary Table S1); (G) H3K4me3 enrichment (ChIP-qPCR) at CD27 and CD27-AS1 TSS; (H) DNMT3B and DNMT3A enrichment to CD27 TSS sense region (ChIP-qPCR); (I) DNMT3B and DNMT3A interaction with CD27-AS1 antisense transcript and with CD27 sense and ACTB transcripts as negative controls (RIP-qPCR); (J) Boxplot showing the methylation level at TSS of sense genes, which expression is reduced compared to the antisense partner (antisense/sense ratio ≥ 1.5 FPKM) and which interacts with DNMT3B at transcript level comparing the immunoprecipitated (DNMT3B-interacting transcripts) and unbound RNA fractions in each cell line. *P-adj <0.05; **P-adj <0.005; ***P-adj <0.0005.

