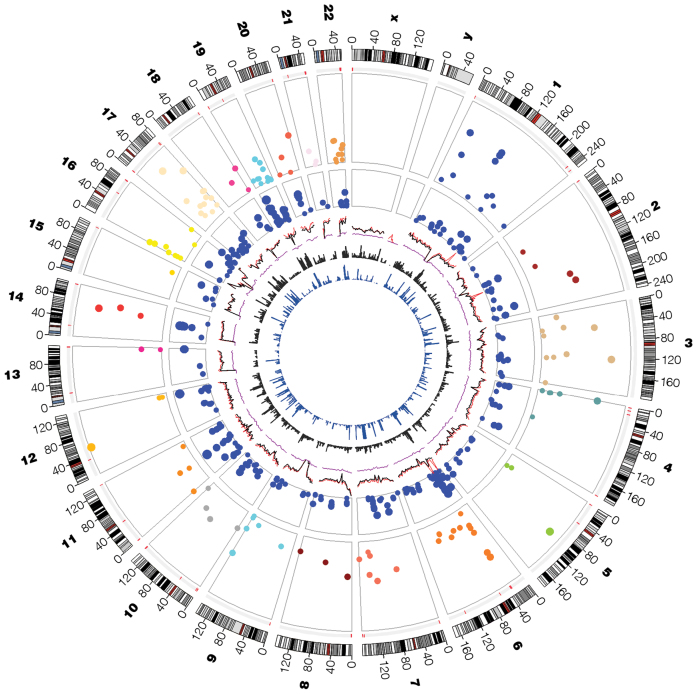
Figure 2.
Circos plot of all detected cerQTLs. Features or glyphs are displayed from the outer to the inner, include the number of chromosome, the chromosome ideograms, copy number variation hotspots (red region), Manhattan plot for cerQTLs with –log10(P-value), Manhattan plot for GWAS TASs in miRNA binding site predicted by TargetScan, genome variant density (red: dbSNP, black: 1000 Genomes, purple: HapMap 3), OMIM gene distribution and disease-susceptible region distribution.

