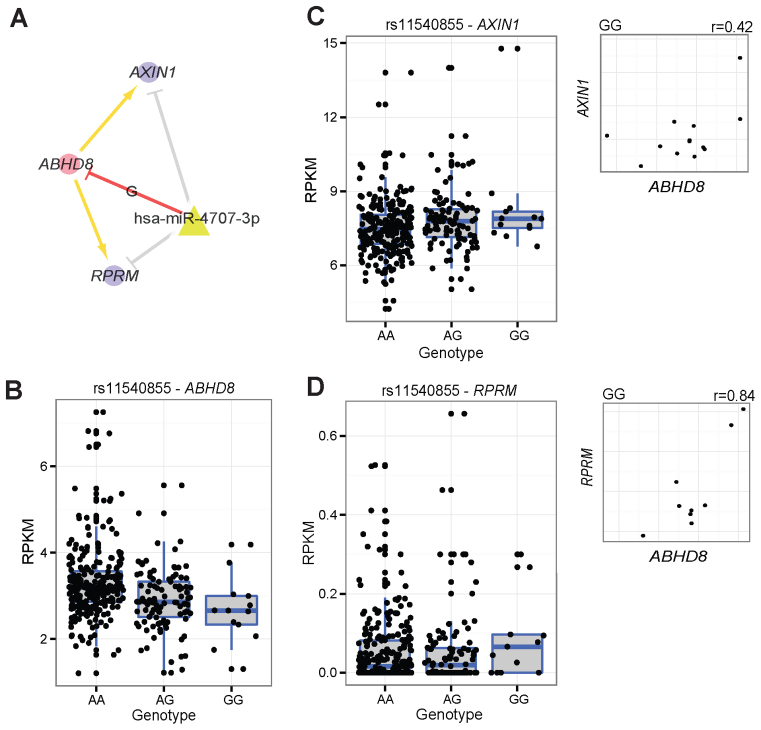
Figure 6.
The genetic effect of rs11540855 in ceRNA regulation for EUR population. (A) Small ceRNA regulatory network driven by rs11540855, circle: ceD and ceTs; triangle: miRNA; suppression line with label: the miRNA-ceD regulation, G for gain-of-function mutation; other suppression lines: the miRNA-ceT regulation; arrow: ceD activate ceTs in gain-of-function situation ( and
and  ). (B) Boxplot of gene expression for ABHD8 on different genotypes of Geuvaids individuals. (C) Boxplot of gene expression for AXIN1 and on different genotypes of Geuvaids individuals and the correlation with ABHD8 on genotype GG. (D) Boxplot of gene expression for RPRM and on different genotypes of Geuvaids individuals and the correlation with ABHD8 on genotype GG.

