Figure 2.
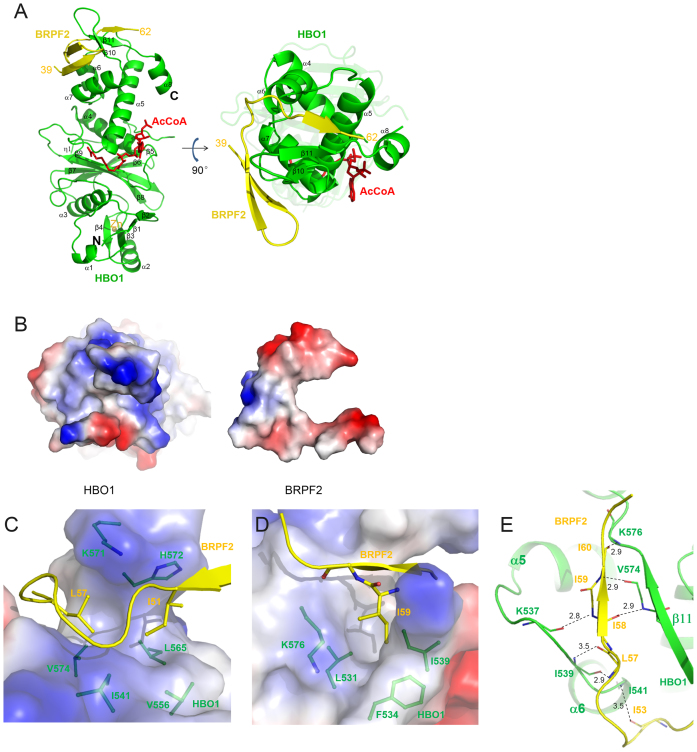
Structure of the HBO1–BRPF2 complex. (A) A ribbon representation of the overall structure of the HBO1–BRPF2 complex. The HBO1 MYST domain and the BRPF2 (residues 39–62) fragment are colored in green and yellow, respectively. The bound AcCoA and Zn2+ are shown with a red stick model and a gray sphere, respectively. (B) Electrostatic surface representations of HBO1 and BRPF2 showing good complementarity in both geometrical and electrostatic properties. (C and D) Hydrophobic interactions between HBO1 and BRPF2. HBO1 is shown with an electrostatic surface and BRPF2 is shown with a ribbon diagram. The residues involved in the hydrophobic interactions are shown with side chains. (E) Hydrophilic interactions between HBO1 and BRPF2. Both HBO1 and BRPF2 are shown with ribbon diagrams. The hydrophilic interactions are indicated with dotted lines and distances.

