Figure 5.
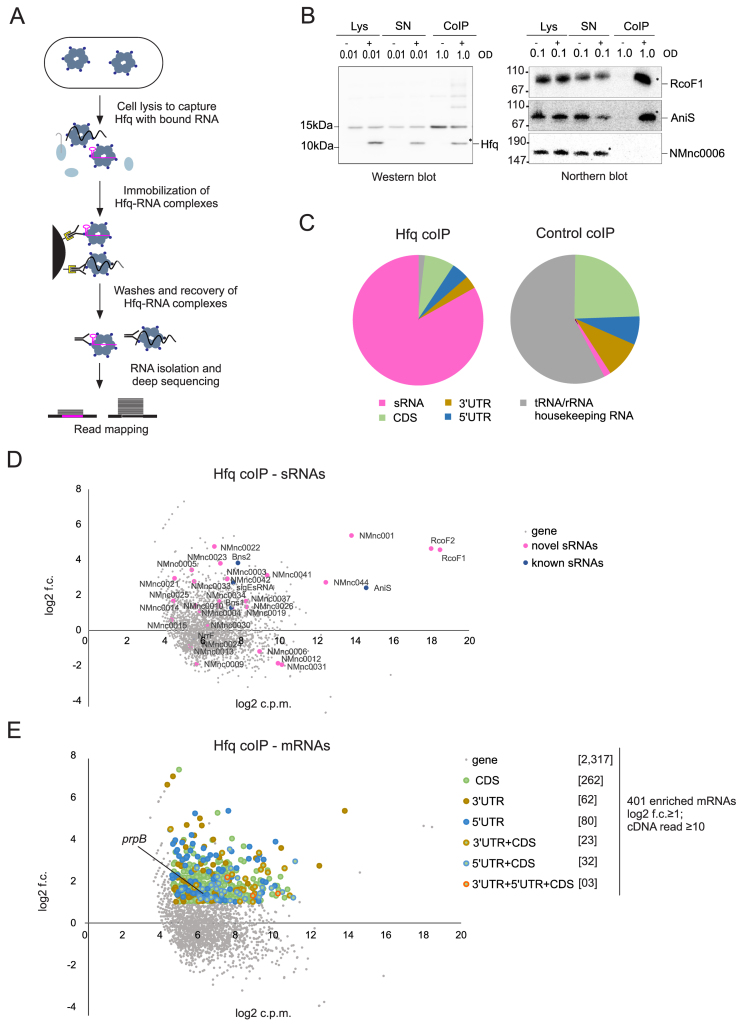
The repertoire of Hfq regulated sRNAs and mRNAs in N. meningitidis 8013. (A) Schematic workflow for generating co-immunoprecipitation (coIP) samples of WT and 3× FLAG tagged hfq strains grown in rich media to mid log phases (OD600 = 0.5) in two independent experiments. (B) Quality of RNA and protein samples was analyzed by western blots and northern blots. Lysate (Lys), supernatant (SN) and coIP samples were obtained from pull-down experiments with mouse anti-FLAG antibody performed in the presence (+) or absence (−) of the 3× FLAG tagged Hfq protein. OD600 equivalents of protein and RNA samples loaded on the gel are shown. Western blot with rabbit anti-FLAG antibody (left panels) and northern blot with probe against RcoF1 and AniS sRNAs as well as NMnc0006 sRNA as negative control (right panel) confirmed the success of Hfq pull-downs. The band indicated by a star within the coIP (+) lanes correspond to the sizes of purified Hfq proteins and co-purified RcoF1 sRNA. Size markers are given on the left (in kDa). (C) Pie chart for Hfq coIP and control coIP showing the relative proportions of all Hfq-associated sequences that unequivocally mapped to different classes of RNA sequences. (D) Scatter-plot of RIP-seq results. Axes represent log fold-change between the control coIP and Hfq coIP (y-axis) and abundance in log counts per million (x-axis) of cDNA reads obtained. New sRNAs and previously described sRNAs are depicted by pink and blue dots, respectively. (E) Scatter-plot analysis of RIP-seq results depicting 401 mRNAs and their associated segments (CDS, 5΄ UTR and 3΄ UTR) that were enriched (log2 f.c. ≥1; cDNA read ≥10) in the Hfq coIP, for example the 5΄ UTR of prpB gene. Axes are identical to above.

