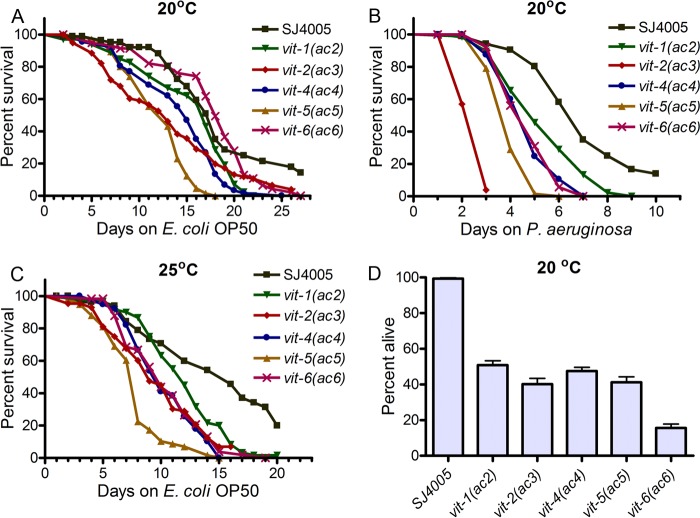
FIG 5 .
VIT protein accumulation adversely affects life span and enhances pathogen susceptibility. (A) Survival of SJ4005 and mutant animals on E. coli OP50 at 20°C. Day 0 represents young adults. P values for the values for mutant animals compared to the values for SJ4005 animals are as follows: P > 0.05 for vit-1(ac2), P < 0.001 for vit-2(ac3), P > 0.05 for vit-4(ac4), P < 0.001 for vit-5(ac5), and P > 0.05 for vit-6(ac6). (B) Survival of SJ4005 and mutant animals on P. aeruginosa PA14 at 20°C. The animals were grown on E. coli OP50 at 20°C until they were 1-day-old adults before being transferred to P. aeruginosa PA14. P values comparing the values for mutant animals relative to the values for SJ4005 animals are as follows: P < 0.01 for vit-1(ac2), P < 0.001 for vit-2(ac3), P < 0.001 for vit-4(ac4), P < 0.001 for vit-5(ac5), and P < 0.001 for vit-6(ac6). (C) Survival of SJ4005 and mutant animals on E. coli OP50 at 25°C. Day 0 represents young adults. P values comparing the values for mutant animals to the values for SJ4005 animals are as follows: P < 0.05 for vit-1(ac2), P < 0.001 for vit-2(ac3), P < 0.001 for vit-4(ac4), P < 0.001 for vit-5(ac5), and P < 0.001 for vit-6(ac6). Survival curves are representative assays of three independent experiments. n = 60 to 100. (D) Percent of animals alive after 5 days of adult life span at 20°C after xbp-1 RNAi. The bar graph shows the means plus SD from three independent experiments.

