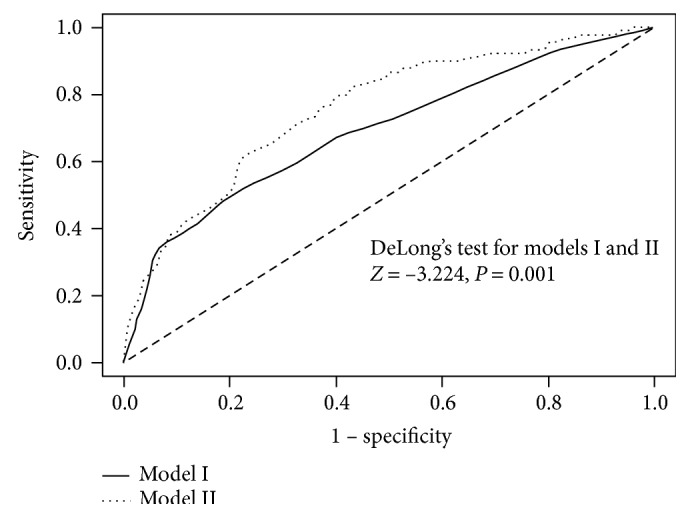
Figure 1.

Areas under the curve between control and colorectal cancer individuals with borderline serum CEA levels (2–4 ng/mL). The prediction model is for discriminating between control and colorectal cancer individuals. Model I was designed only with the observed CEA level, whereas model II was designed with the observed CEA level and the adjusted CEA level.
