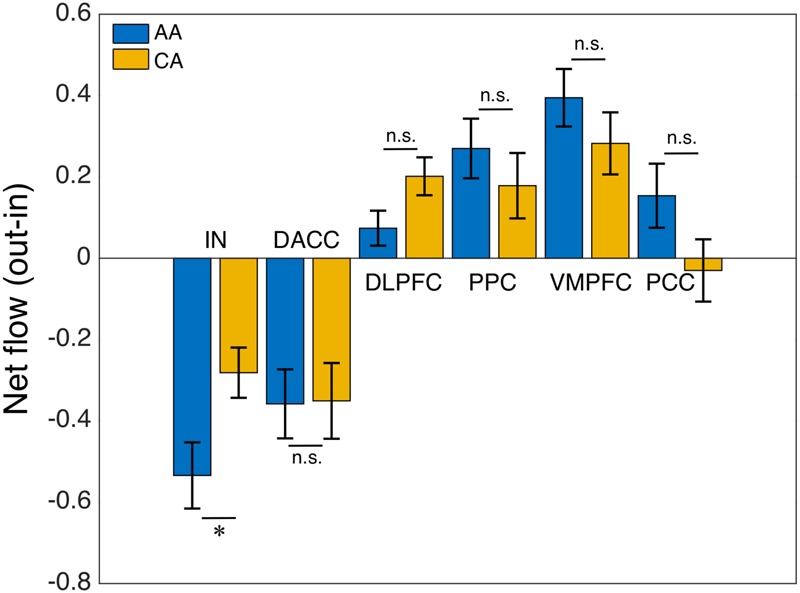
FIGURE 3.

African–Americans (AA) versus Caucasian–Americans (CA) comparison: net flow (out-in) of the key nodes of the salience (IN, insula; DACC, dorsal anterior cingulate cortex), central-executive (DLPFC, dorsolateral prefrontal cortex; PPC, posterior parietal cortex) and default-mode (VMPFC, ventromedial prefrontal cortex; PPC, posterior cingulate cortex) networks. The AI of AA group had a significantly lower net flow (out-in) compared with that of CA group (∗indicates statistical significance; ns indicates not significant).
