
FIGURE 5.
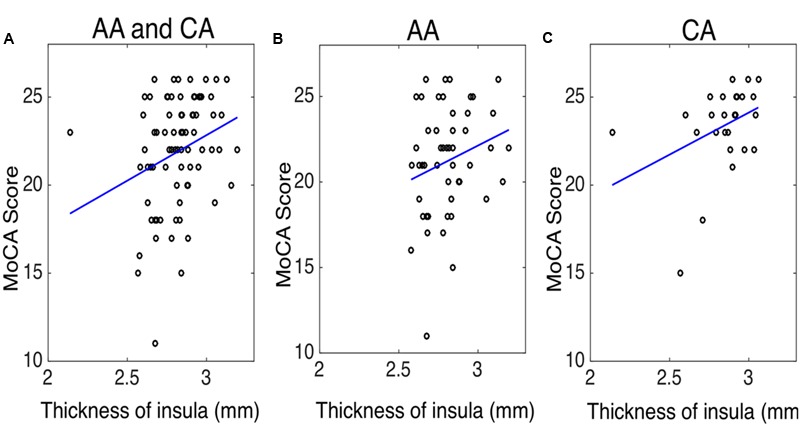
The correlation between the thickness of insula and the Montreal cognitive assessment (MoCA) score in (A) both African–Americans (AA) and Caucasian–Americans (CA) (r = 0.30 and p < 0.05), (B) AA (r = 0.19 and p = 0.18), and (C) CA (r = 0.40 and p < 0.05).