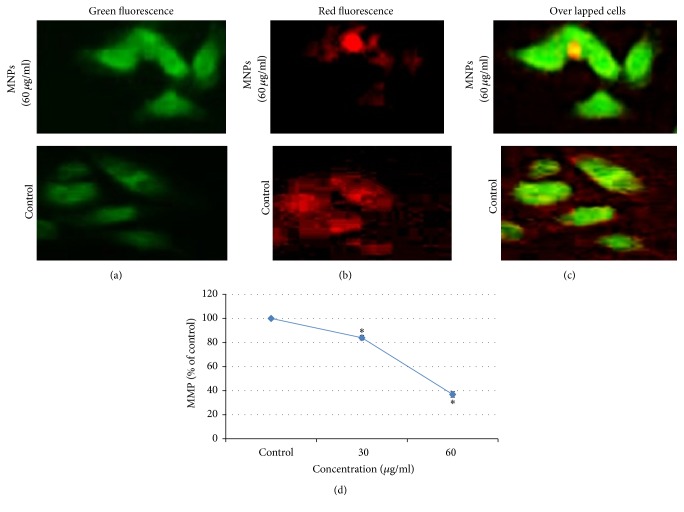
Figure 6.
Induction of MMP in SH-SY5Y cells at 60 μg/ml of MNPs exposure. (a) Indicates green fluorescence (JC-1 monomer); (b) Indicates red fluorescence (JC-1 aggregate); (c) Indicates overlapped cells (green-red fluorescence); (d) % MMP ratio. Data are expressed as the mean ± SE of three experiments. n = 3, ∗p < 0.05 versus control.

