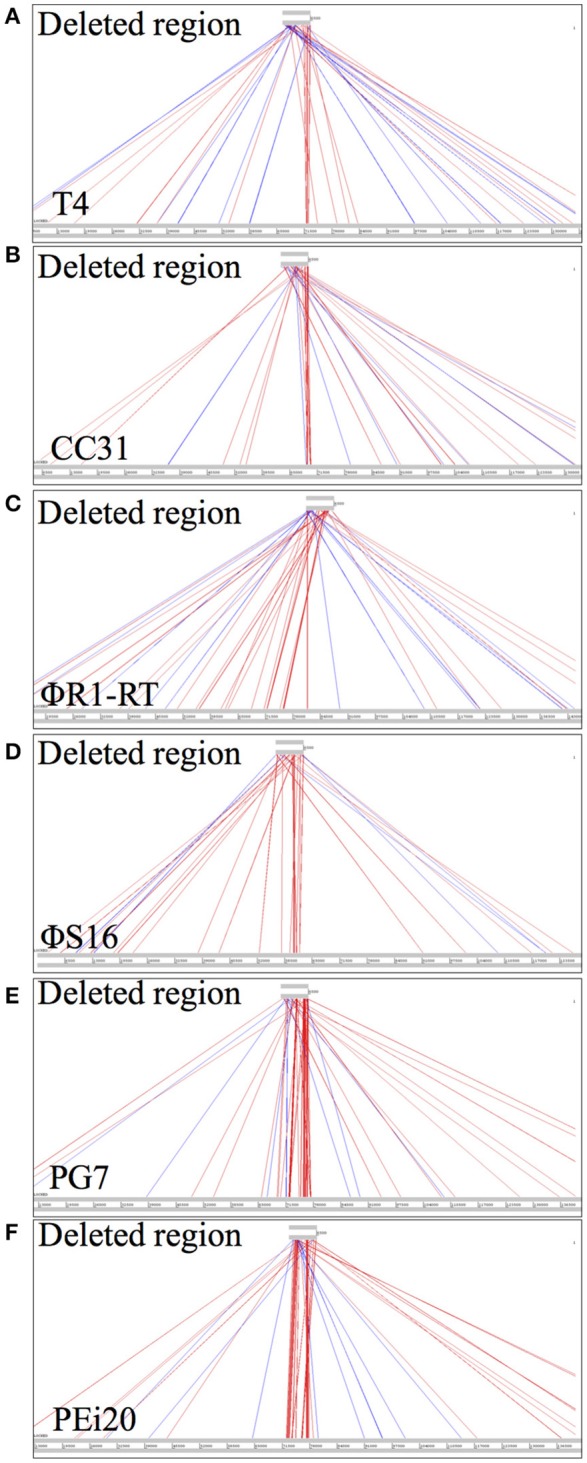
Figure 5.

DNA sequence comparisons of the smallest deleted region in ΦCBH8o (6.5 kb) with other T4-like phages, using ACT. (A) Comparison with phage T4. (B) Comparison with CC31. (C) Comparison with ΦR1-RT. (D) Comparison with ΦS16. (E) Comparison with PG7. (F) Comparison with PEi20.
