Figure 7.
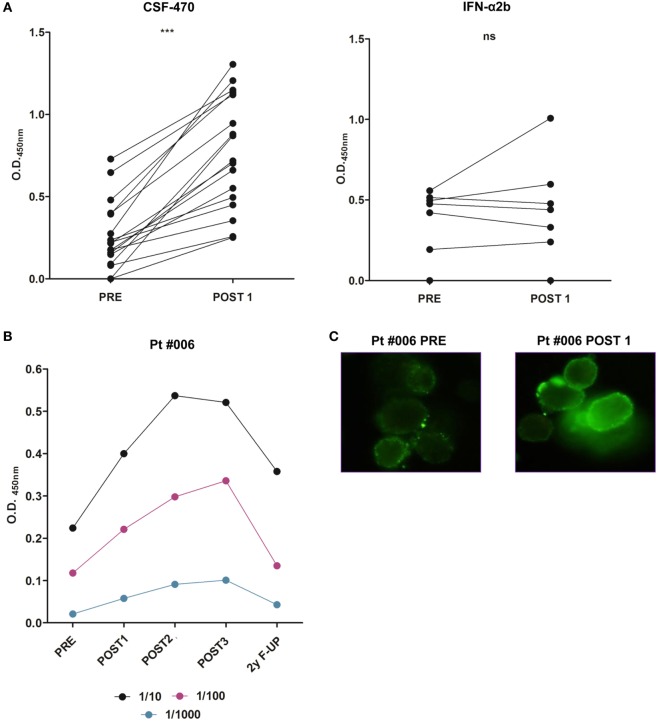
Serum reactivity to MelC of PRE and POST1 samples of patients (pts) participating in CASVAC-0401 study, detected by ELISA (unpaired t-test, ***p < 0.0001). Optical density (O.D.450 nm) from each sample is shown as O.D.450nm = O.D. pt serum sample − O.D. healthy donor serum sample. A total of 1/10 serum dilution is shown (A). Serum reactivity to autologous tumor cells of patient #006 was detected by ELISA. A total of 1/10, 1/100, and 1/1,000 serum dilutions are shown (B). Immunofluorescence staining of autologous patient #006 tumor cells with PRE and POST 1 sera showing cell surface reactivity (original magnification: 400×). Antibodies were detected by FITC-rabbit anti IgA, G, and M (DAKO). PRE, POST1, POST2, and POST3 correspond to samples obtained at 0, 6, 12, and 24 months from protocol start. F-UP (follow-up) sample was obtained 24 months after ending protocol participation (C).

