
FIGURE 3.
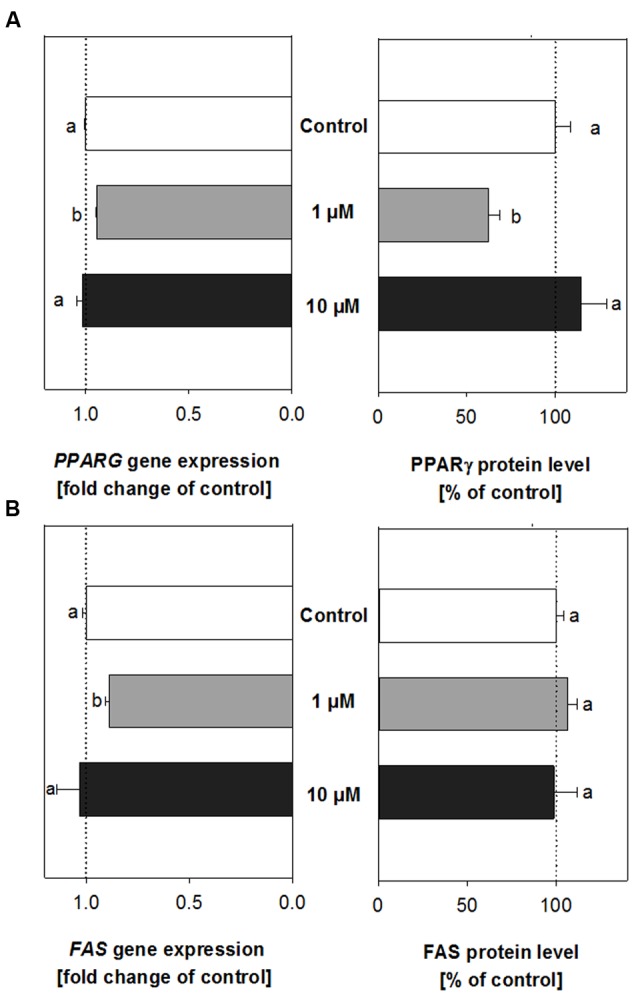
PPARγ (A) and fatty acid synthase (FAS) (B) gene expression and protein levels in cells treated with either 1 μM (gray bars) or 10 μM (black bars) trans-pellitorine in comparison to control (0.1% EtOH) treated cells (white bars). Statistics: differences in PPARG and FAS gene expression were assessed using one-way ANOVA on Ranks with Dunn’s post hoc test, n = 3–4 with three technical replicates each. Significant differences (p < 0.05) in PPARγ and FAS protein levels were analyzed with one-way ANOVA and Holm–Sidak post hoc test (n = 3–5, with two technical replicates) or one-way ANOVA on Ranks with Dunn’s post hoc test, respectively; n = 4 with two technical replicates. Significant differences between the groups are marked with distinct lower-case letters.