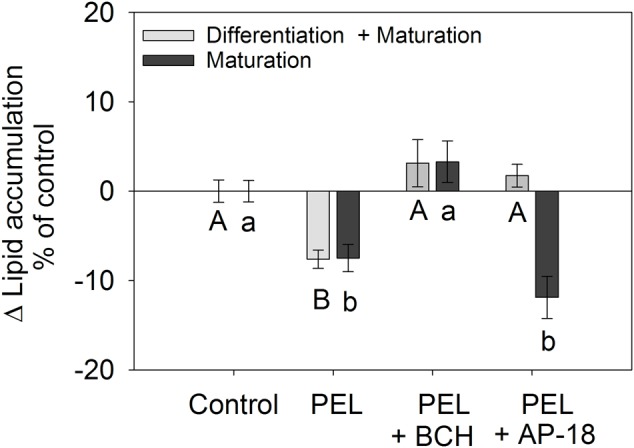
FIGURE 4.

Difference in lipid accumulation in % of control (0.1% EtOH) ± SEM after addition of 1 μM trans-pellitorine (PEL) with or without the addition of 25 μM of the TRPV1 antagonist BCH or 1 μM of the TRPA1 antagonist AP-18 during differentiation and maturation for 12 days (light gray bars) or during maturation for 10 days (dark gray bars) after initiation of differentiation of 3T3-L1 cells. Lipids were stained using oil red O dye and the results are shown as the mean difference of control treated cells from 3 to 6 independent experiments with multiple technical replicates. Significant differences (p < 0.05) to the corresponding control treated cells were analyzed by one-way ANOVA on Ranks with Dunn’s post hoc test and are marked with distinct capital letters for the treatments during differentiation + maturation phase and lower-case letters for the treatments during maturation phase.
