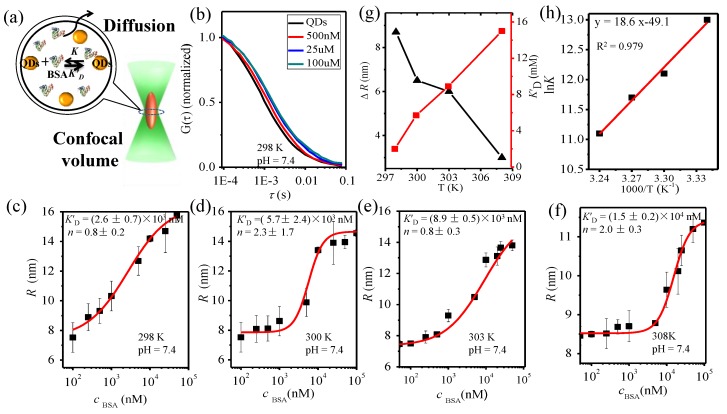
Figure 2.
(a) Scheme of FCS system; (b) FCS correlation curves; (c–f) hydrodynamic radii of QDs-COOH at different BSA concentrations (pH = 7.4) at different temperatures (298 K, 300 K, 303 K, and 308 K); (g) Plot of K′D (red line), ∆R (black line) versus temperature; and (h) the plot of lnK against 1/T.

