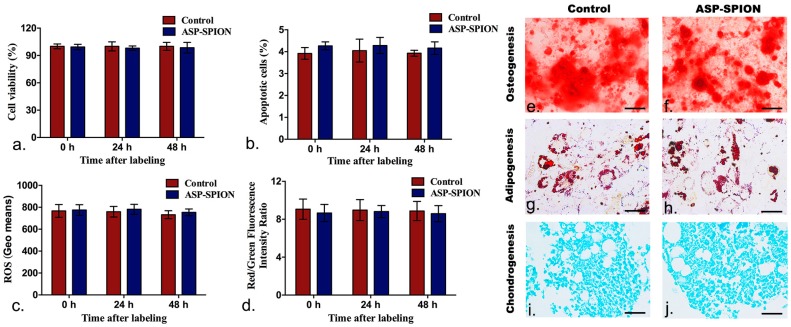
Figure 5.
In vitro cytotoxicity assay of cell labeling. Graphs show no significant differences in the cell viability (a), apoptosis rate (b), intracellular ROS level (c) , and mitochondrial membrane potential (d) at 0, 24 and 48 h after labeling with ASP-SPIONs in comparison with control cells. Values represent means ± SD, n = 6, p > 0.05. (e–j) Presentative micrographs show that abundant calcium nodules indicating osteogenesis (e,f), red-staining oil granules indicating adipogenesis (g,h), and synthesis of proteoglycans indicating chondrogenesis (i,j) in both labeled and unlabeled mesenchymal stem cells (MSCs). Scale bar for e–h: 100 μm; scale bar for i and j: 50 μm.

