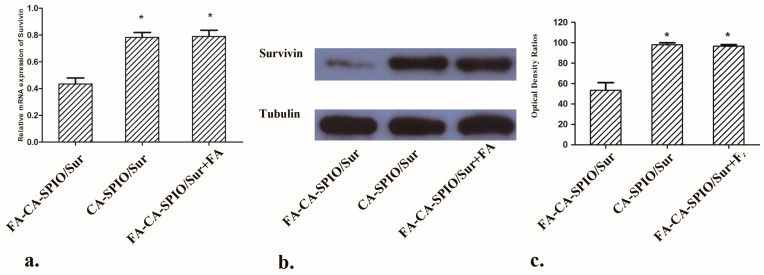
Figure 6.
Survivin gene expression analysis. (a) A graph showing the quantification of survivin mRNA expression in cells treated with the superparamagnetic iron oxide nanoparticle (SPIO)-loaded cationic amylose complexed with survivin siRNA (CA-SPIO/Sur), folate-conjugated CA-SPIO/Sur (FA-CA-SPIO/Sur) and FA-CA-SPIO/Sur plus FA. *: p < 0.05 FA-CA-SPIO/Sur group; (b) Western blot analysis show protein expression level of survivin in HepG2 cells incubated with various nanocomplexes of CA-SPIO/Sur, FA-CA-SPIO/Sur and FA-CA-SPIO/Sur plus FA. Tubulin is used as a loading control; and (c) a graph showing the corresponding optical density ratios of survivin to tubulin bands as detected by Western blot analysis in CA-SPIO/Sur, FA-CA-SPIO/Sur, and FA-CA-SPIO/Sur plus FA groups. *: p < 0.05 compared with FA-CA-SPIO/Sur group.

