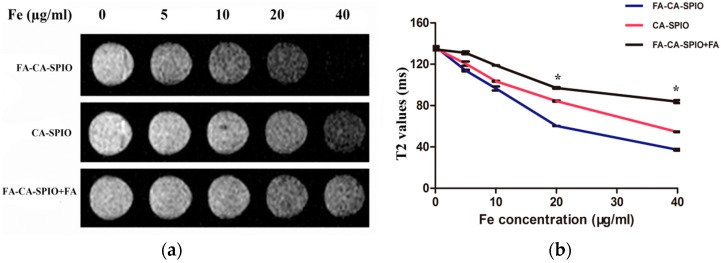
Figure 7.
MRI of the cell uptake. (a) T2*-weighted image shows the signal intensity of HepG2 cells incubated with superparamagnetic iron oxide nanoparticle (SPIO)-loaded cationic amylose (CA-SPIO), folate-functionalized CA-SPIO, and FA-CA-SPIO plus FA; and (b) a graph showing the T2 values of the cells incubated with various nanocomplexes at different iron concentration. *: p < 0.05.

