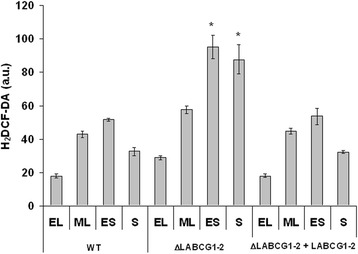
Fig. 6.

ROS levels along the growth cycle of Leishmania lines. Promastigotes (1 × 10⁷) were collected at early logarithmic (EL), mid logarithmic (ML), early stationary (ES) and stationary (S) phases of growth (2, 4, 6 and 10 days, respectively) and basal ROS levels were measured by means of an H2DCFDA assay. Data are the mean ± SD of three independent experiments. Significant differences versus the respective control line were determined using Student’s t-test (*P < 0.05)
