
Fig. 3.
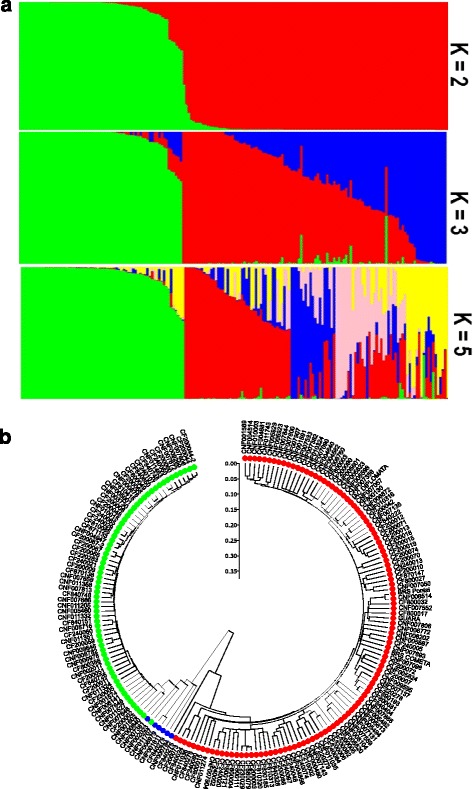
Population structure a Population structure inferred by the Bayesian approach based on SNPs for K = 2 to 5. K = 2 subdivided genotypes in Mesoamerican (red) and Andean (green). K = 3 subdivided the Mesoamerican genotypes into two groups: M1 (red) and M2 (blue). K = 5 subdivided the Mesoamerican genotypes into four groups: M1 (red), M2 (blue), M3 (pink), and M4 (yellow). b Dendrogram showing the division between the two gene pools: Andean (green), Mesoamerican (red), and admixture (blue)