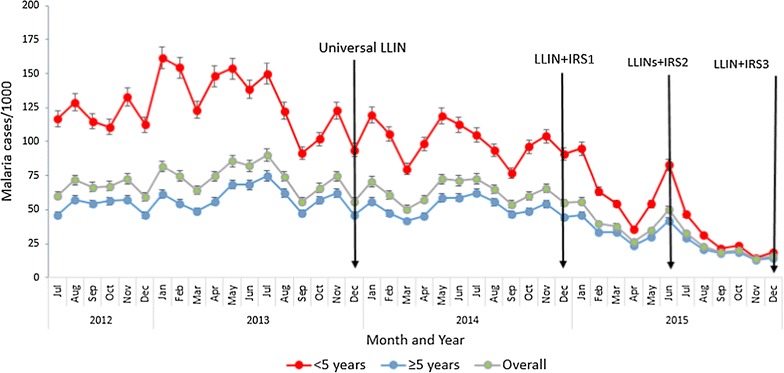
Fig. 2.

Trend of monthly malaria incidence in Tororo District before and following vector control interventions 2012-2015. The figure shows overall and age stratified changes in monthly malaria incidence before and following intensified vector control interventions. Logistic regression analysis of monthly incidence trend showed no significant reduction from January to December 2014 when LLINs were used without IRS (OR = 0.99, 95% CI 0.96–1.01, P = 0.37). Combining LLINs with IRS in 2015 was followed by significant reduction in monthly malaria incidence during January to December 2015 (OR = 0.89, 95% CI 0.87–0.92, P < 0.05). There was no significant reduction of monthly malaria incidence among under fives (OR = 0.98, 95% CI 0.97–1.00, P = 0.08) and the ≥5 age individuals (OR = 0.99, 95% CI 0.97–1.02, P = 0.8) from January to December 2014 when LLINs were used without IRS. On the other hand, introduction of IRS to complement LLINs in December 2014 was followed by significant reduction in monthly malaria incidence in 2015 among children <5 years of age (OR = 0.94, 95% CI 0.91–0.996, P < 0.0001) and those ≥5 years of age (OR = 0.91, 95% CI 0.88–0.94, P < 0.0001)
