Fig. 4.

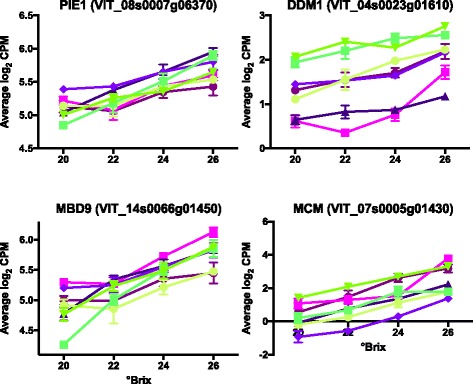
Expression profiles of some genes involved in chromosome organization. Data shown are the means ± SE; n = 3. Error bars not shown are smaller than the symbol. Symbol legend is the same as in Fig. 3

Expression profiles of some genes involved in chromosome organization. Data shown are the means ± SE; n = 3. Error bars not shown are smaller than the symbol. Symbol legend is the same as in Fig. 3