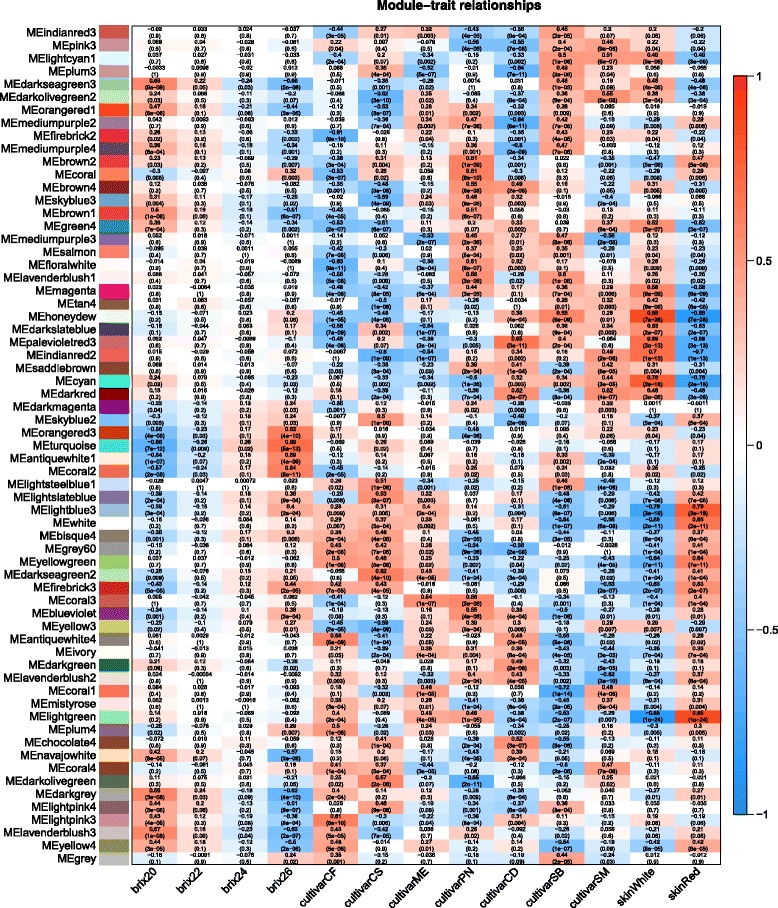
Fig. 6.

Heatmap correlation of berry traits (°Brix level, cultivar, red vs white grape) of each of 64 gene modules. Gene modules were identified by a color name (MEcolornumber) as assigned by the WGCNA R package. Values in each heatmap block are the correlation (upper) and p-value (lower) of the module eigengene with the berry trait
