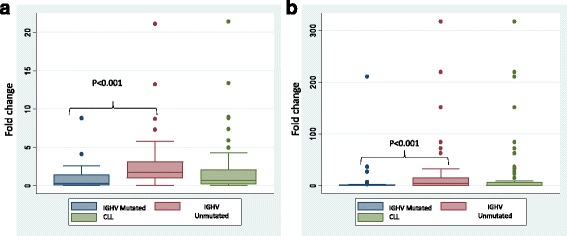
Fig. 4.

Box-plot representation of mRNA expression fold change as assessed by RQ-PCR for a CRY1 gene in CLL and its IGHV mutated and unmutated subgroups b PAX9 gene in CLL and its IGHV mutated and unmutated subgroups. Box-plot graphs show median (middle line), interquartile range (box), 25–75th percentile (whiskers) and statistically significant difference (p value) estimated in comparison between different groups
