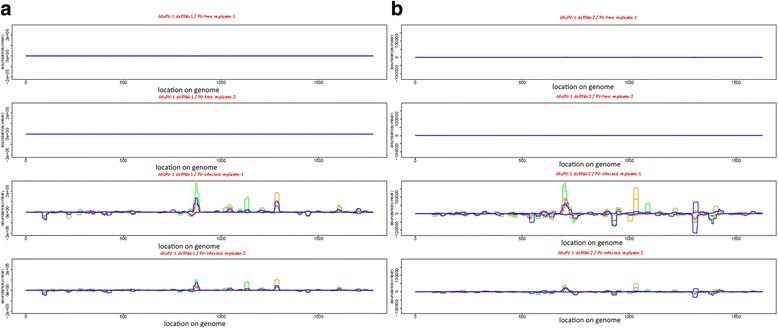
Fig. 3.

Presence plots showing the distribution and abundance of Aspergillus fumigatus partitivirus-1 (AfuPV-1)-derived sRNAs for the 2 segments of the AfuPV-1 genome. Double-stranded RNA segments 1 and 2 are presented in subplots a and b, respectively. The red, green, orange and blue lines indicate 19 nt, 20 nt, 21 nt and 22 nt siRNAs, respectively. The abundance plot of reads matching to the positive strand is presented as positive abundance, whereas the abundance plot of reads incident to the negative strand are presented as negative abundances. Genomic coordinates are shown on the x-axis and the point cumulative abundance of all incident reads (on a linear scale) are shown on the y axis.
