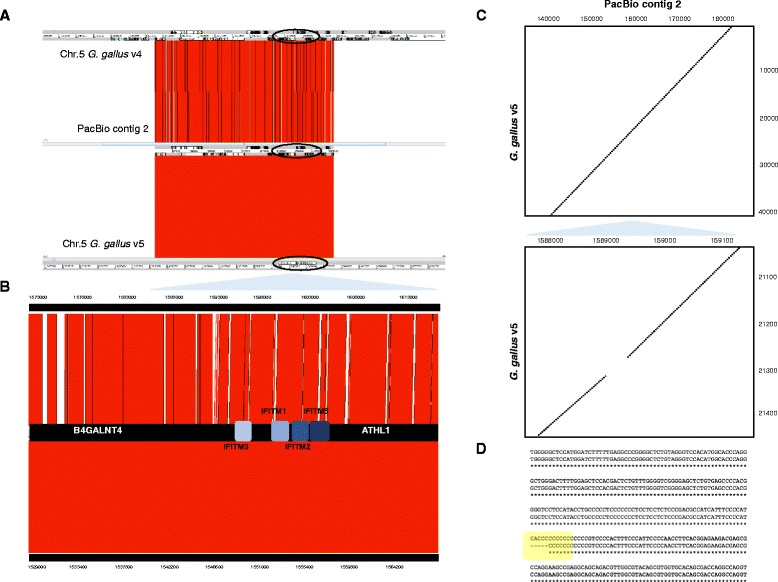
Fig. 1.

Locus comparison between PacBio consensus sequence (contig 2) and a portion of chromosome 5 of the two versions of the chicken genome. a: The 203 kb BAC reference sequence contained in the PacBio contig 2 (in the middle) is compared with chromosome 5 of Gallus gallus v4 (top) or v5 (bottom) using ACT, Artemis Comparison Tool. The annotation files for Gallus gallus v4 and PacBio contig 2 have been compressed to allow visualization of the whole BAC; for Gallus gallus v5 it was drawn manually only to visualize location of the locus. b: The chIFITM locus (circled in A) is enlarged in B to show only the chIFITM locus including the flanking genes (this is a 40 kb region extracted from the 203Kb total). Gaps are visible in Gallus gallus v4 represented by white bars (N nucleotides), while these are absent in the comparison with the more complete Gallus gallus v5. The graph does not show differences at the nucleotide level, but only an overall view of the locus. c: Dot Plot comparison graphs of the assembled PacBio contig 2 versus Gallus gallus v5 showing differences not visible when using ACT for the 40Kb region. The region enlarged in the right Dot Plot shows a stretch of the genomic region within the intronic region of the chIFITM3 gene which shows differences with chicken genome assembly v5. d Clustal Omega alignment of the PacBio contig 2 consensus sequences and the chicken genome v5 (portion of the IFITM3 gene corresponding to the gap seen in 2C). In yellow is highlighted the gap
