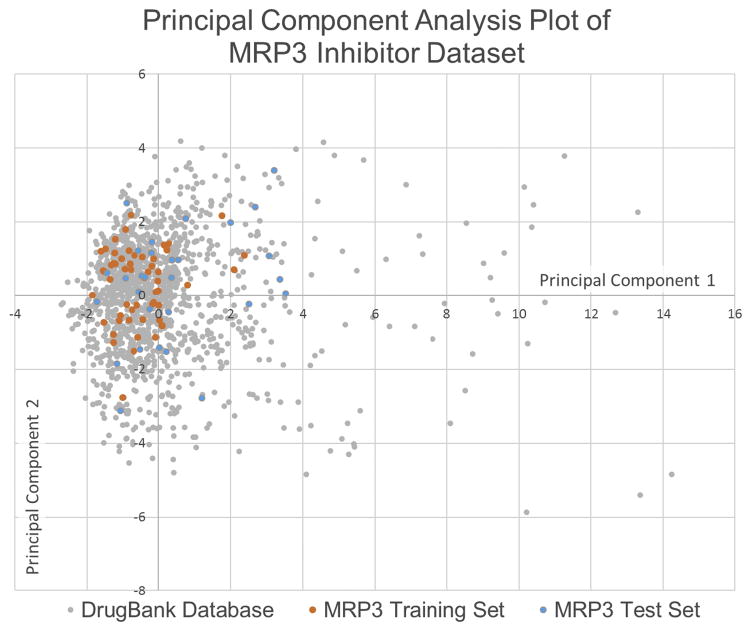
Fig 3. Principal component analysis of datasets.
The principal component analysis of the calculated molecular features for the MRP3 inhibitor dataset used to develop the Bayesian model and the FDA-approved dataset that was virtually screened. The plot demonstrates that the MRP3 inhibition training and test sets occupy a similar chemical space to a majority of the virtually screened dataset.

