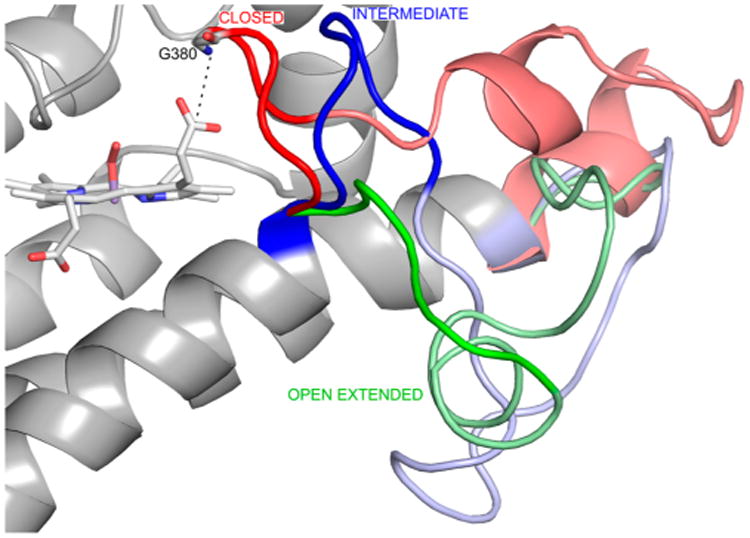
Figure 2.

Three JK loop conformations resulting from clustering analysis of JK loopC in the SF, Cf1, and Cf2 states. The closed, intermediate, and open-extended conformations are colored red, blue, and green, respectively. In each conformation, the JK loopC and JK loopN regions are highlighted by the bright and pale colors, respectively. The dashed line indicates the distance between the backbone N atom of Gly380 and the carbon atom of the heme propionate 7 group.
