Fig. 1.

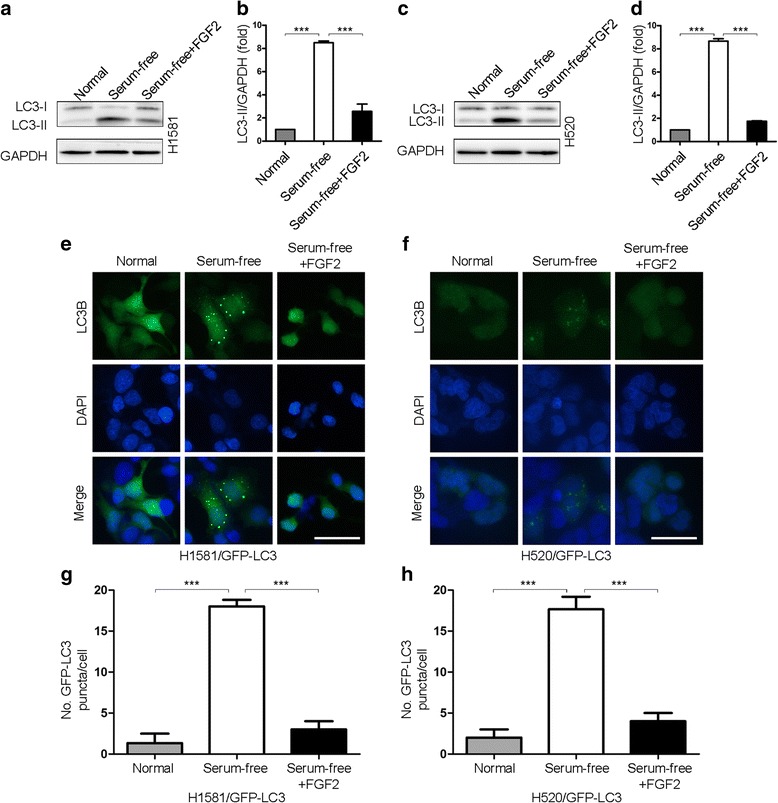
FGFR1 activation inhibits autophagy. a LC3-I/II western blot analysis in H1581 NSCLC cells cultured O/N in normal medium, serum-free medium, or serum-free medium plus FGF2 (25 ng/ml, 2 h). b Quantification of LC3-II levels in (a); mean ± SD, n = 3, ***p < 0.001. c LC3-I/II western blot analysis in H520 cells in conditions shown in (a). d Quantification of LC3-II levels in (c); mean ± SD, n = 3, ***p < 0.001. e Representative images of GFP-LC3 puncta in H1581/GFP-LC3 cells in conditions shown in (a). Scale bars represent 25 μm. f Representative images of GFP-LC3 puncta in H520/GFP-LC3 cells in conditions shown in (c). Scale bars represent 25 μm. g Quantitation of GFP-LC3 puncta in conditions shown in (e); mean ± SD, n = 3, ***p < 0.001. h Quantitation of GFP-LC3 puncta in conditions shown in (f); mean ± SD, n = 3, ***p < 0.001
