Fig. 2.

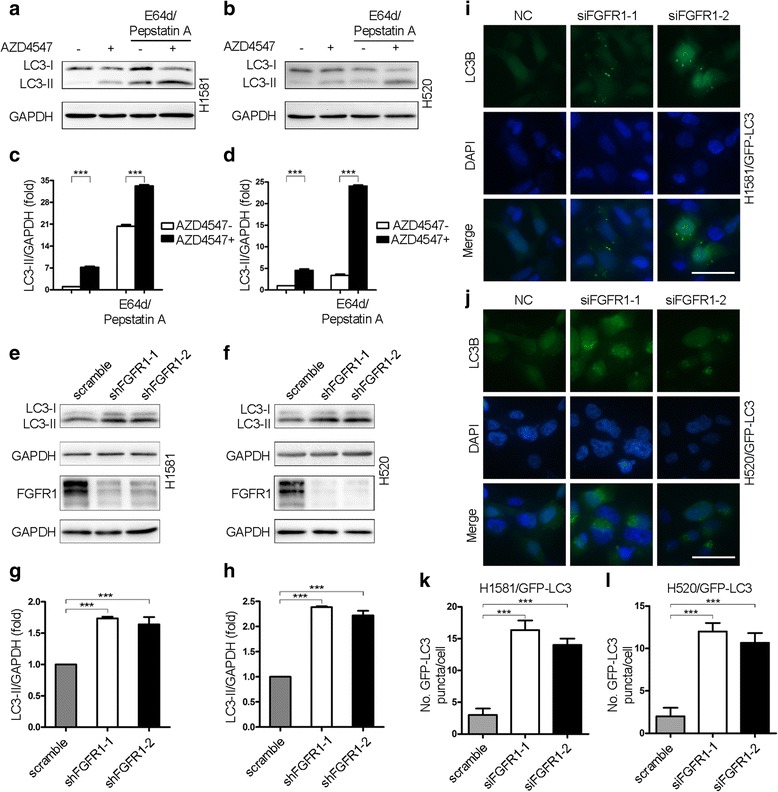
FGFR1 inhibition induces autophagic activity. a H1581 cells were treated with 1 μM AZD4547 for 24 h. The last 8 h was in the presence or absence of E64d (10 μg/ml) and pepstatin A (10 μg/ml). Protein levels of LC3-I/II, and GAPDH were measured by western blot assays. b H520 cells were treated with 1 μM AZD4547 for 24 h. E64d and pepstatin A were added to the cells 8 h before harvesting. c Quantification of LC3-II levels in (a); mean ± SEM, n = 3, ***p < 0.001. d Quantification of LC3-II levels in (b); mean ± SEM, n = 3, ***p < 0.001. e The levels of LC3-II and GAPDH were determined by western blot in H1581 cells stably transduced by shRNA targeting FGFR1 and a control shRNA. FGFR1 and GAPDH protein expression levels by western blot were included as a control for the efficiency of shRNA knockdown. f Confirmation of changes in levels of autophagy after knockdown of FGFR1 by western blot with antibodies against LC3-I/II in H520 cells. g Quantification of LC3-II levels in (e); mean ± SD, n = 3, ***p < 0.001. h Quantification of LC3-II levels in (f); mean ± SD, n = 3, ***p < 0.001. i H1581/GFP-LC3 cells transfected with either siRNA targeting FGFR1 or negative control (NC) were analyzed by fluorescence microscopy to determine the distribution of punctate GFP-LC3. E64d and pepstatin A were added for 8 h before fixation. Scale bars represent 25 μm. j Punctate GFP-LC3 distribution of H520/GFP-LC3 cells transfected with two independent FGFR1 siRNA constructs or a negative control. E64d and pepstatin A were added for 8 h before fixation. Scale bars represent 25 μm. k Quantification of levels of autophagy in H1581/GFP-LC3 cells transfected with control siRNA or siRNA against FGFR1 in conditions shown in (i); mean ± SD, n = 3, ***p < 0.001. l Quantification of data from (j); mean ± SD, n = 3, ***p < 0.001
