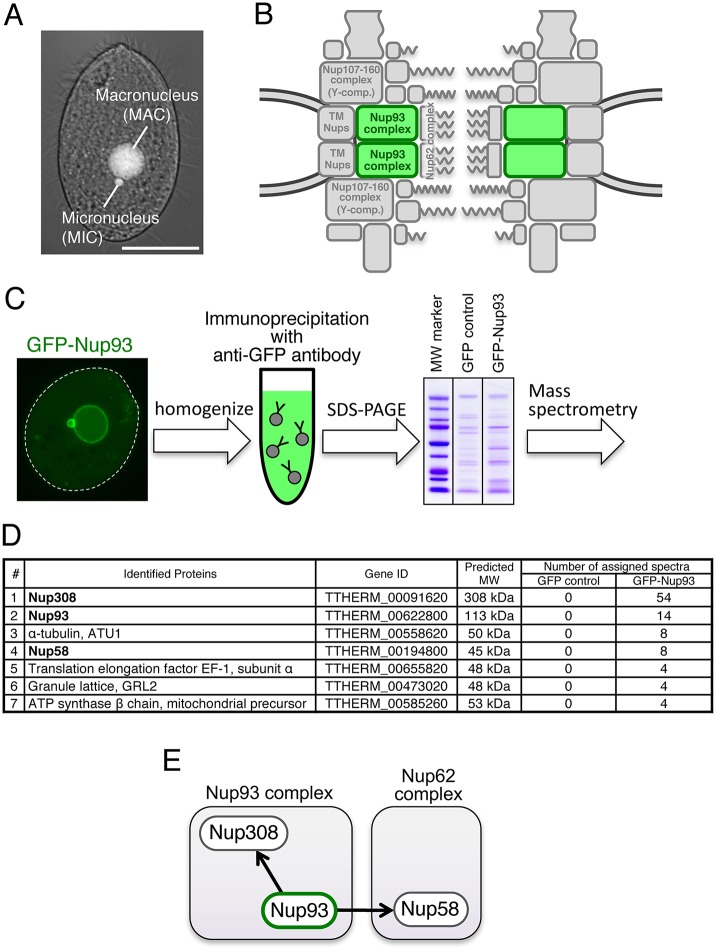
Fig. 1.
Immunoprecipitation and mass spectrometry analysis to identify Nup93 complex members. (A) A T. thermophila cell fixed with methanol and stained with DAPI to visualize the MAC and MIC. Scale bar: 20 μm. (B) The position of the Nup93 complex within the NPC architecture. See also Fig. S1. (C) Simplified procedure of immunoprecipitation and mass spectrometry for GFP–TtNup93-expressing cells used for immunoprecipitation. (D) Mass spectrometric identification of the proteins co-precipitated with GFP–TtNup93. The top seven proteins are listed among other identified proteins (further results are given in Table S2). (E) Physical interaction map of Nup93 based on the mass spectrometry results. MW, molecular mass.

