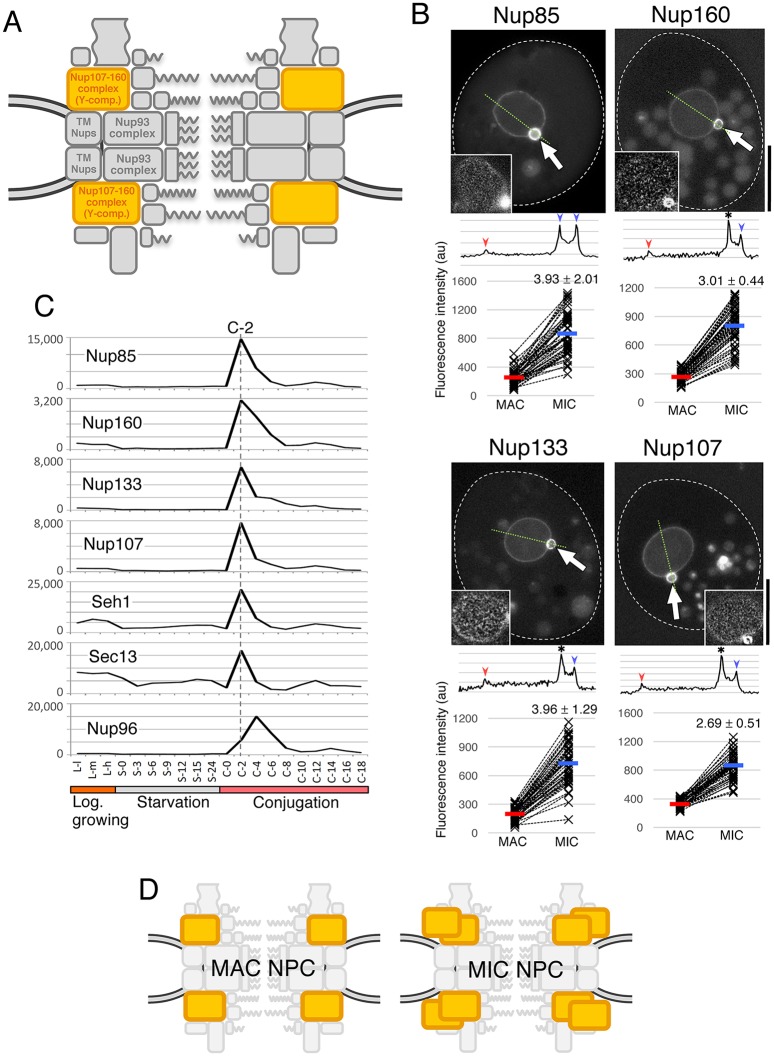
Fig. 3.
Y-complex components localize to both nuclei but are biased to MICs. (A) The position of the Y-complex (orange) within the NPC architecture. (B) Fluorescent micrographs of GFP-tagged Nups ectopically expressed in Tetrahymena cells. White broken lines represent the borders of cells. The inset in each panel shows a deconvoluted image focused on the MAC surface. Arrows indicate the position of the MIC. Scale bars: 20 μm. A line profile of fluorescence intensity along the thin green broken line is presented under each image panel. Blue and red arrowheads indicate the points corresponding to MIC and MAC envelopes, respectively. An asterisk marks the point at which the borders of the two nuclei overlap, and where the intensity is measured as the sum of both NEs. Below the line profile, the fluorescence intensities of MAC and MIC NEs from 50 cells are plotted. The vertical axis of the graph is shown in arbitrary units. Broken lines connect the plots of MAC and MIC within the same cell. Average values are presented by red and blue bars for the MAC and MIC, respectively. The numbers upon the MIC plots indicate fold increase (±s.d.) of fluorescence in MIC from MAC. All differences are significant (P<10−20 by Student's t-test). (C) Expression profiles of the Y-complex members extracted from the TetraFGD (http://tfgd.ihb.ac.cn/). Plots are the average of two values presented in the database. The horizontal axis represents successive stages of culture growth and therefore different physiological conditions. For the logarithmic growth stage, L-l, L-m, and L-h represent low, medium, and high cell concentrations, respectively. For starvation and conjugation stages, numbers represent hours after the transfer of the cells to each condition. The vertical axis represents relative values of mRNA expression. For details, visit the database website. (D) A simple representation of the deduced composition of MAC and MIC NPCs with different numbers of Y-complexes.

