Fig. 4.
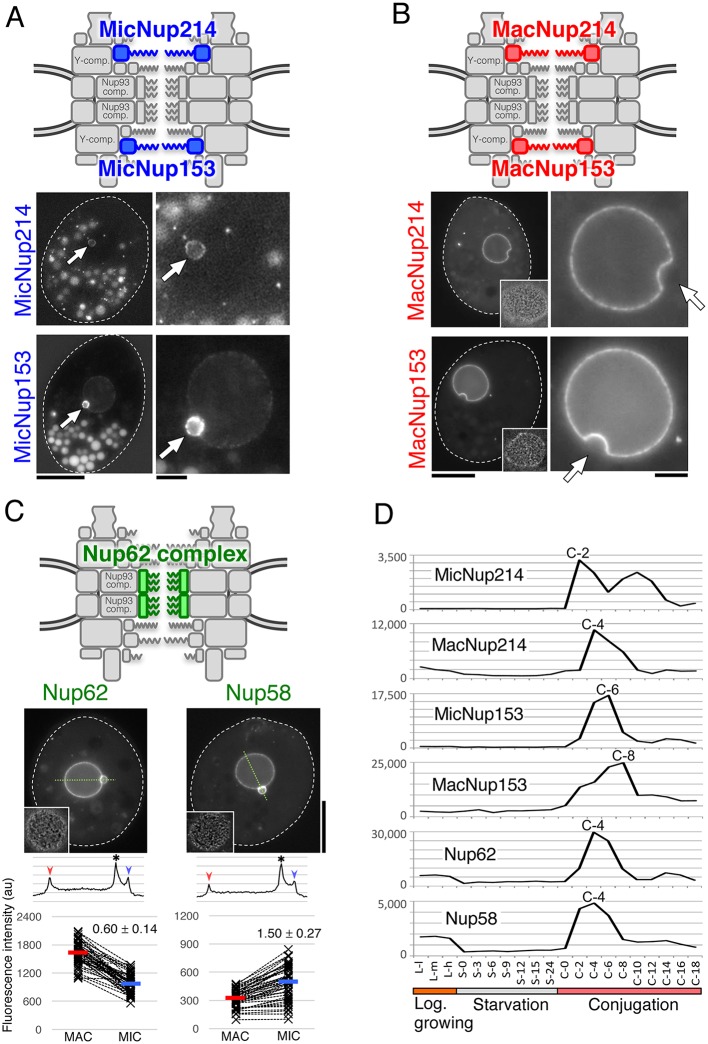
Newly identified FG-Nups of Tetrahymena. (A) MIC-specific paralogs of Nup214 and Nup153. The upper figure indicates the predicted positions of these Nups within the MIC NPC. Fluorescence micrographs show the subcellular localization of fluorescent protein-tagged Nups; MicNup214 and MicNup153 were endogenously tagged with GFP and mNeon at the C-termini of their ORFs, respectively. Arrows indicate the position of the MIC. Other fluorescent bodies dispersed in the cytoplasm are phagosomes taking in materials derived from the culture medium. (B) MAC-specific paralogs of Nup214 and Nup153. The upper figure indicates the predicted positions of these Nups within the MAC NPC. Fluorescence micrographs show the subcellular localizations of ectopically expressed GFP-tagged Nups. The left panels show a whole cell, and each nuclear region is enlarged in the right panels. White broken lines represent the borders of cells. Insets in the left panels show deconvoluted images focused on the MAC surface. Arrows indicate the position of MICs. (C) TtNup62 and TtNup58 localized to both nuclei. The upper illustration indicates the predicted position of these Nups, which are members of the Nup62 complex. Fluorescent micrographs show the subcellular localizations of ectopically expressed GFP–TtNup62 and TtNup58–GFP. Line profiles and plots of fluorescence intensity are shown under each image panel in the same manner as in Fig. 3B. Both differences are significant (P<10−16 by Student's t-test). (D) Expression profiles of FG-Nups, as in Fig. 3C. Scale bars: 20 μm (A,B, left panels; C); 5 μm (A,B, right panels).

