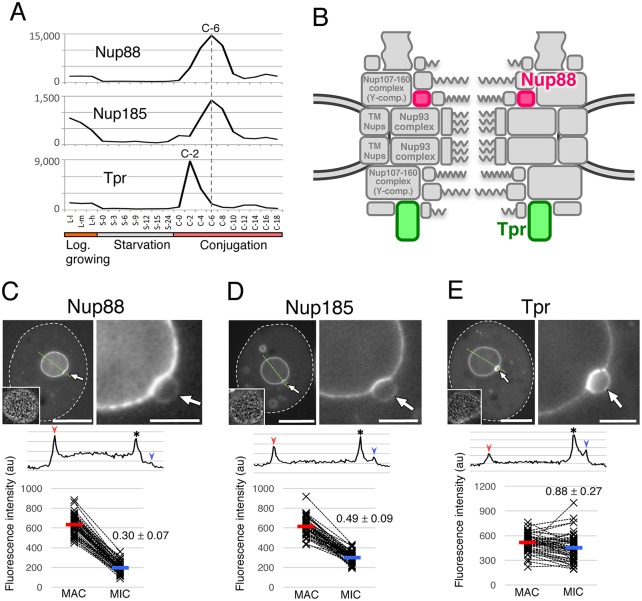
Fig. 5.
Nuclear localization and expression profiles of Nup88, Nup185 and Tpr. (A) Expression profiles of Nup88, Nup185 and Tpr. (B) The predicted positions of TtNup88 and TtTpr in the NPC. The position of Nup185 is unknown. (C) The subcellular localization of ectopically expressed GFP–TtNup88. The fluorescence intensity of the MIC NE is significantly lower than that of the MAC NE (P<10−39). (D) Subcellular localization of ectopically expressed GFP–Nup185. The fluorescence intensity of the MIC NE is significantly lower than that of the MAC NE (P<10−30). (E) Subcellular localization of ectopically expressed GFP–TtTpr. The fluorescence intensity of the MIC NE is slightly lower than that of the MAC NE (P=0.0024). The left panels in C–E show a whole cell, and its nuclear region is enlarged in the right panels. White broken lines represent the borders of cells. The inset in the left panels show the deconvoluted image focused on the MAC surface. Arrows indicate the position of the MICs. A line profile and plots of fluorescence intensity are shown under each image panel, as in Fig. 3B. All P-values were calculated with a Student's t-test. Scale bars: 20 μm (C–E, left panels); 5 μm (C–E, right panels).

