Fig. 1.
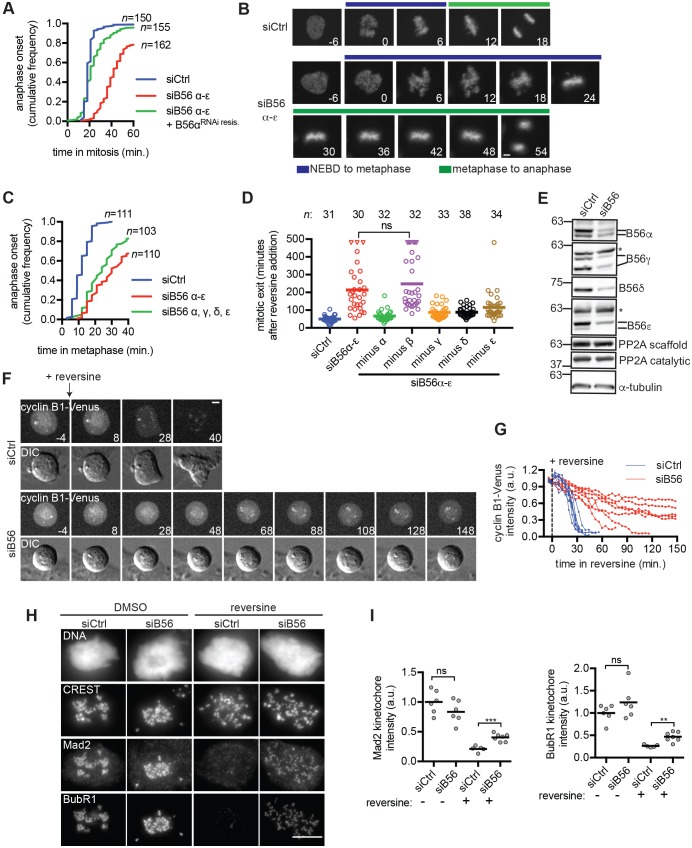
PP2AB56 promotes the timing of anaphase and mitotic exit. (A–C) PP2AB56 depletion delays anaphase onset. (A,B) RPE1 cells expressing RNAi-resistant B56α and/or H2B–mCherry were transfected with siRNA targeting B56α, B56β, B56γ, B56δ and B56ε (siB56α-ε) or control siRNA (siCtrl) and imaged live. (A) The duration of mitosis was measured for individual cells. Plotted is the fraction of cells that entered anaphase as a function of time in mitosis. (B) Representative micrographs. Numbers indicate time (min) relative to nuclear envelope breakdown (NEBD). The time to metaphase (blue bar) and time from metaphase to anaphase (green bar) is indicated. (C) RPE1 cells expressing H2B–mCherry were treated with siCtrl, siB56α-ε, or a mixture of siRNAs against B56α, B56γ, B56δ and B56ε (siB56) and imaged live. The cumulative anaphase onset is plotted. (D) Depletion of PP2AB56 delays mitotic exit. RPE1 cells were treated with siCtrl, siB56α-ε or mixtures in which an siRNA against a single B56 isoform had been omitted. Cells were treated with nocodazole for 2 h and then imaged live before and after reversine addition. The median time of mitotic exit (line) and exit time of individual cells (open circles) is plotted. Triangles indicate cells that remained in mitosis at the end of the imaging period. (E) siCtrl and siB56 mitotic HeLa lysates were probed by western blotting. Asterisk indicates non-specific band. (F,G) Cyclin B1 proteolysis is delayed in siB56 cells. (F) RPE1 CCNB1Venus/+ siCtrl or siB56 cells were treated as described in D and imaged live. Still images from differential interference contrast (DIC) and fluorescent imaging are shown. Numbers indicate time (min) relative to addition of reversine. (G) Plotted is the fluorescence intensity relative to reversine addition. Each line indicates a single cell and the last time point plotted is either mitotic exit or the experimental end-point (150 min). (H,I) siB56 cells have increased recruitment of Mad2 and BubR1 when Mps1 is inhibited. RPE1 siCtrl or siB56 cells were incubated with nocodazole and MG132, and treated with or without reversine before processing for immunofluorescence microscopy. (H) Maximum intensity projection images of representative cells used for quantification shown in I. (I) Quantification of kinetochore recruitment. Each circle represents the average kinetochore signal of one cell. Line indicates mean; a.u., arbitrary units; n.s., not significant (P>0.05), **P<0.005, ***P<0.0005, Student's two-tailed t-test. Results are representative of three independent experiments. n indicates number of cells analyzed from three experiments (A,C) or single experiment (D). Scale bars: 5 μm.

