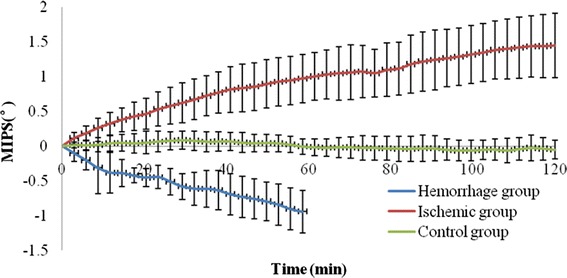
Fig. 5.

MIPS measurement results for three groups, where the X-axis indicates the measurement time, while the Y-axis indicates the MIPS data. The data in each group were the average value of all group animals concerned. The data from the hemorrhage group were normalized relative to the baseline data without injection, and the data from ischemic group were normalized to the baseline data before ligation. The data from the control group were also normalized relative to the initial value
