FIGURE 2.

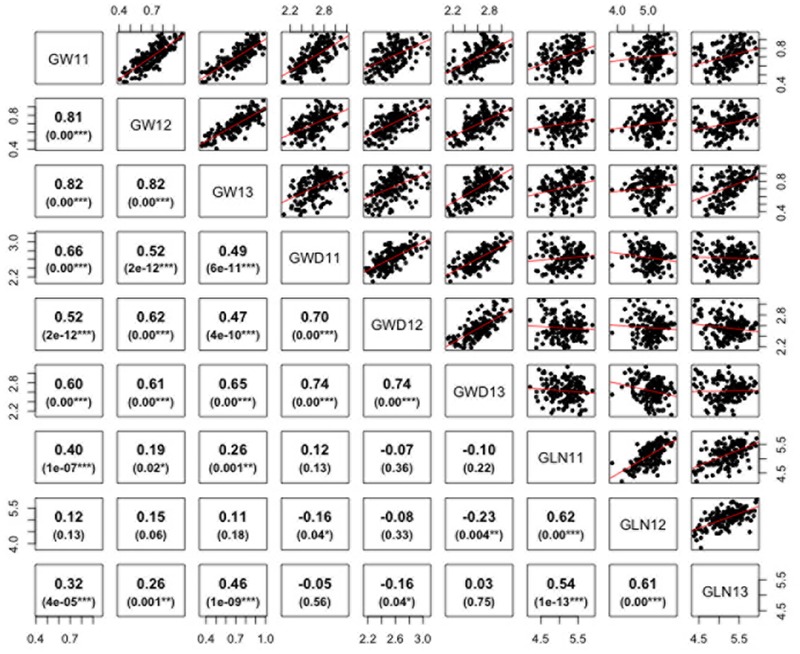
Correlations between grain weight, length, and width in Ae. tauschii for 2011–2013. p-Value for significant correlations is shown at the bottom. ∗∗∗, ∗∗, and ∗, Significant at p < 0.001, p < 0.01, and p < 0.05, respectively.

Correlations between grain weight, length, and width in Ae. tauschii for 2011–2013. p-Value for significant correlations is shown at the bottom. ∗∗∗, ∗∗, and ∗, Significant at p < 0.001, p < 0.01, and p < 0.05, respectively.