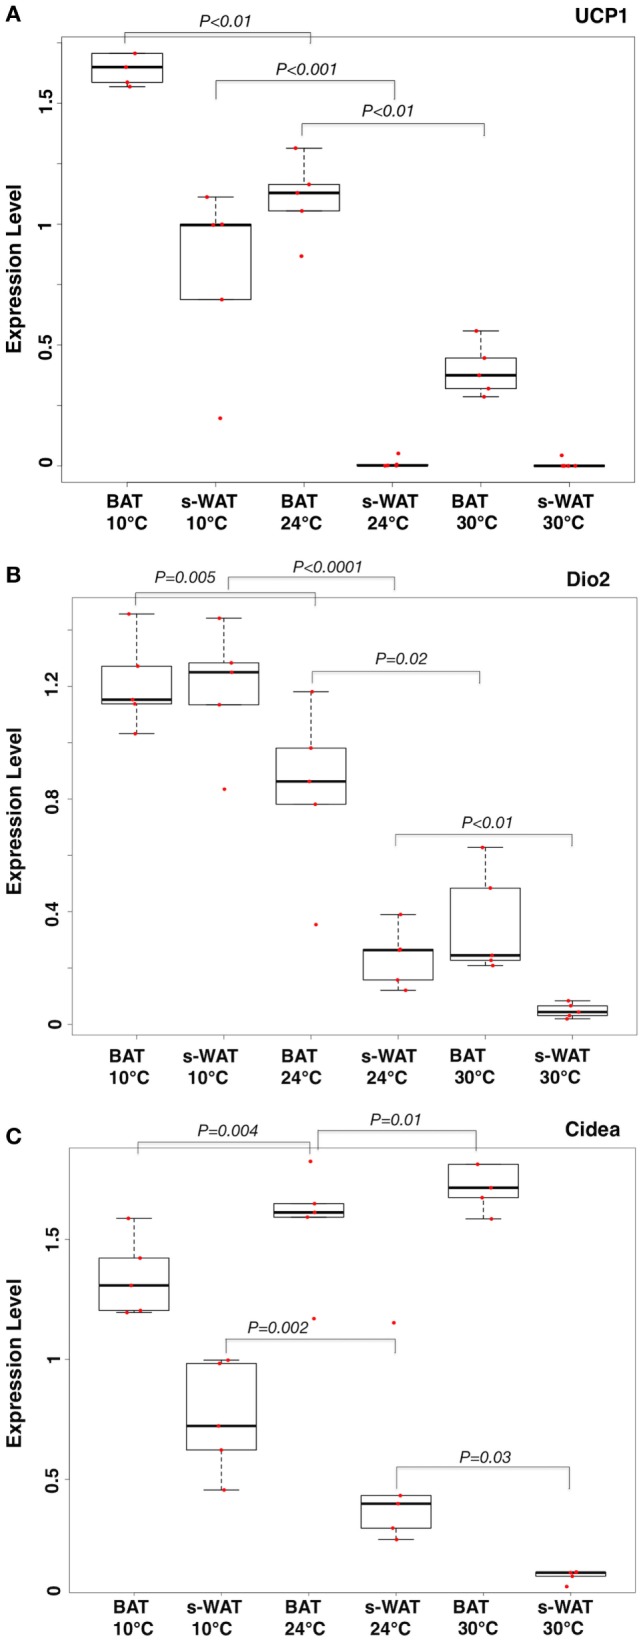
Figure 1.

Boxplots showing the relative expression levels of uncoupling protein 1 (UCP-1) (A), Dio2 (B), and Cidea (C) in brown adipose tissue (BAT) and subcutaneous white adipose tissue (s-WAT) for individual data points measured from each animal at 10, 24, and 30°C is shown. Statistical analysis of adipose thermogenic markers between temperature groups was assessed by ANOVA followed by post hoc F-test and p-values were reported. Stepwise increase in UCP-1 level going from 30 to 24 to 10°C BAT (p < 0.01) was reported. UCP-1 level in 10°C s-WAT was greater than 24 and 30°C s-WAT (p < 0.001). p < 0.05 were accepted as the level of significance. N = 5; N represents the number of animals per adipose tissue/temperature.
