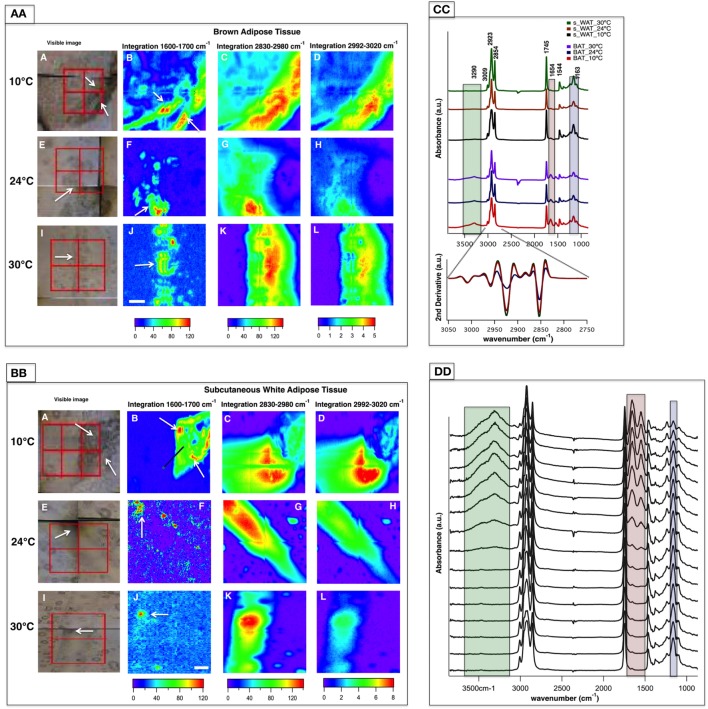
Figure 3.
Fourier transform infrared (FTIR) images derived from brown adipose tissue (BAT) (AA) and subcutaneous white adipose tissue (s-WAT) (BB) at 10, 24, and 30°C are shown. Data are representative of one tissue section. N = 5; N represents the number of animals per adipose tissue/temperature. Panels A, E, and I are bright-field images of adipose tissues. Each tissue covers the area of 280 × 280 µm2 (2 × 2 tiles; each tile = 64 × 64 pixels; each pixel = 2.2 × 2.2 µm2). FTIR images from integrated area under 1,600–1,700 cm−1 associated with proteins (Panels B, F, and J), 2,830–2,980 cm−1 associated with saturated lipids (Panels C, G, and K), and 2,992–3,020 cm−1 associated with unsaturated fatty acids (Panels D, H, and L) are shown. Colors indicate component gradients from low (blue) to high (red) and the values are shown below each panel. The scale bar is 40 µm. (CC) Average of nearly 1,000 pixel spectra (3,600–900 cm−1) and a corresponding second derivative spectra (3,050–2,750 cm−1) for BAT and s-WAT at 10, 24, and 30°C are shown. (DD) Stack of spectra from the linescan drawn in (BB)/Panel B is shown. The starting spectrum in the stack (from bottom) is the spectrum derived from the green dot shown in [(BB)/Panel B]. The protein regions of the spectra are highlighted with pink, and green rectangles in Panels CC and DD to show the differences in protein absorbance.

