Figure 4.
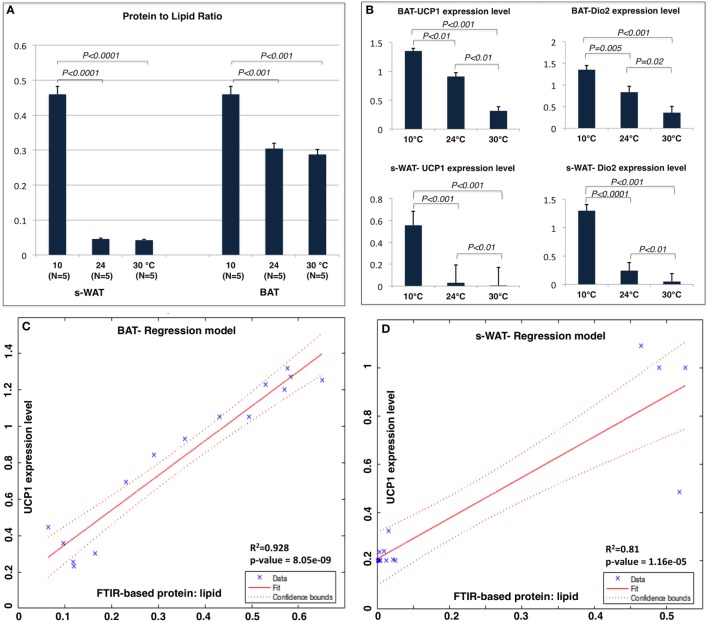
(A) Protein to lipid ratio from Fourier transform infrared (FTIR) spectra generated from 10, 24, and 30°C brown adipose tissue (BAT) and subcutaneous white adipose tissue (s-WAT). FTIR spectra were derived from the tiles that were selected for FTIR imaging. Ratio was calculated by dividing the integral of protein band area (1,700–1,600 cm−1) to the integral of saturated lipid band area (2,980–2,830 cm−1). Stepwise increases in protein to lipid ratio going from 30 to 24 to 10°C BAT (p < 0.001) and s-WAT (p < 0.0001) were observed. (B) The uncoupling protein 1 (UCP-1) and Dio2 expression levels shown in Figure 1 are reshown here for reference to make direct comparison with protein to lipid ratio. Statistical analysis of UCP-1 and Dio2 relative expression levels in BAT and s-WAT at 10, 24, and 30°C are shown. Stepwise increase in UCP-1 level going from 30 to 24 to 10°C BAT (p < 0.01) was reported. UCP-1 level in 10°C s-WAT was greater than 24 and 30°C s-WAT (p < 0.001). Dio2 level was greater in 10°C BAT and s-WAT than 24°C (p = 0.005 and p < 0.0001) and 30°C (p < 0.001 and p < 0.001) BAT and s-WAT. N = 5; N represents the number of animals per adipose tissue/temperature. (C,D) Correlation from linear regression model, suggesting that protein to lipid ratio from FTIR measurements was positively correlated with UCP-1 expression level in BAT (Panel C—R2 = 92.8%; p < 0.0001) and s-WAT (Panel D—R2 = 81.0%; p < 0.0001). The confidence bounds are 95%. Quantitative measurements were derived from multiple analyses of several tissue slices from different animals (N = 5) and then combined to provide a value. p < 0.05 were accepted as the level of significance and error bars represent 95% confidence intervals.

