Figure 6.

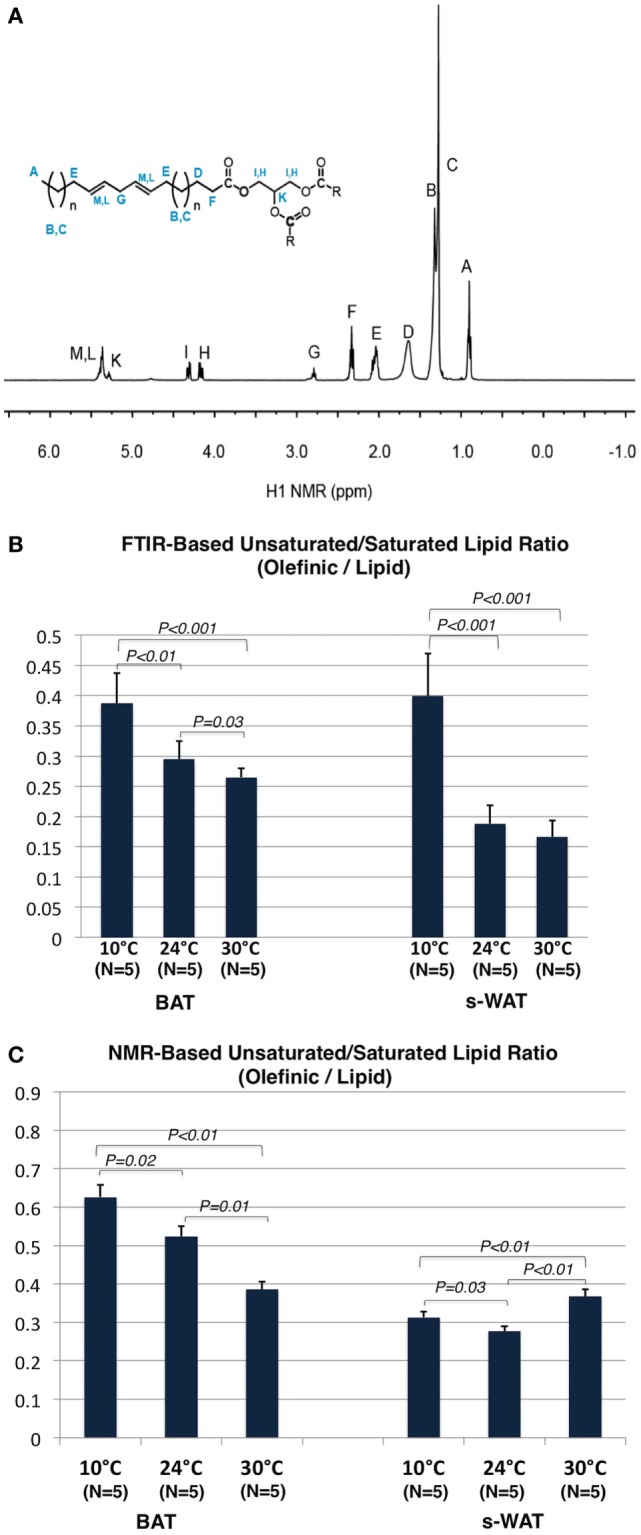
(A) 1H NMR spectrum of an adipose tissue and the structure of triacylglycerol (TAG). (B) Olefinic to lipid ratio from Fourier transform infrared (FTIR) spectra generated from 10, 24, and 30°C tissues, was calculated by dividing the integral of the olefinic band area (3,020–2,992 cm−1) to the integral of saturated lipid band area (2,980–2,830 cm−1). The same baseline region (3,050–2,750) was used. Stepwise increases in this ratio going from 30 to 24°C (p = 0.03) to 10°C (p < 0.01) brown adipose tissue (BAT) and subcutaneous white adipose tissue (s-WAT) (p < 0.001) were observed. (C) Olefinic to lipid ratio from 1H NMR spectra generated from 10°C, 24°C, and 30°C BAT and s-WAT, was calculated by dividing the integral of the peak “G” area to the integral of the peak “A” area. Stepwise increase in this ratio from NMR measurements, from 30 to 24°C (p = 0.01) to 10°C (p = 0.02) BAT was reported. Olefinic to lipid ratio in s-WAT decreased from 30 to 24°C (p < 0.01) group and then followed by an increase to 10°C (p = 0.03) group. p < 0.05 were accepted as the level of significance and error bars represent 95% confidence intervals.
