
Fig. 2.
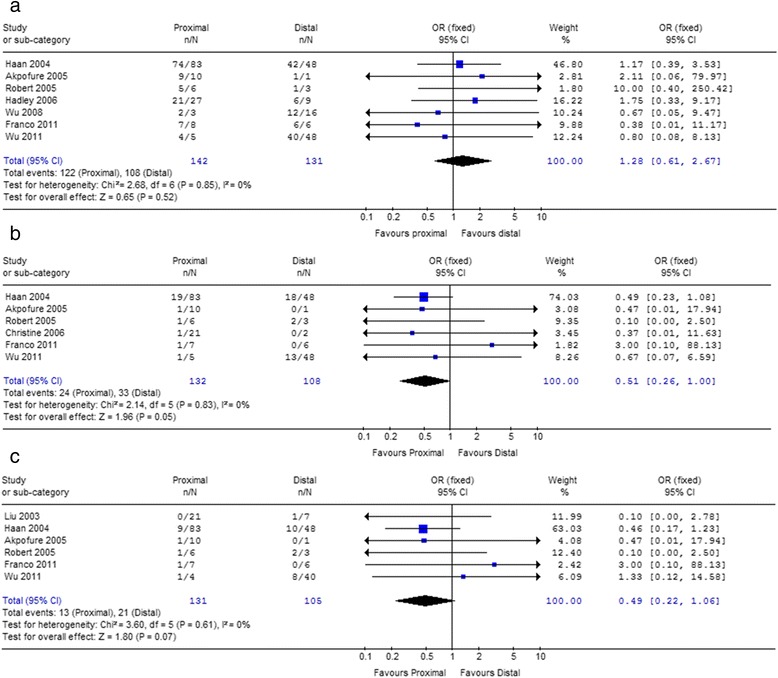
Forest plot of embolization locations (Proximal vs Distal) associated with success rate (a), severe complications (b) and the incidence of DC III (c) in 2nd study set
Official websites use .gov
A
.gov website belongs to an official
government organization in the United States.
Secure .gov websites use HTTPS
A lock (
) or https:// means you've safely
connected to the .gov website. Share sensitive
information only on official, secure websites.
Forest plot of embolization locations (Proximal vs Distal) associated with success rate (a), severe complications (b) and the incidence of DC III (c) in 2nd study set