Fig. 3.
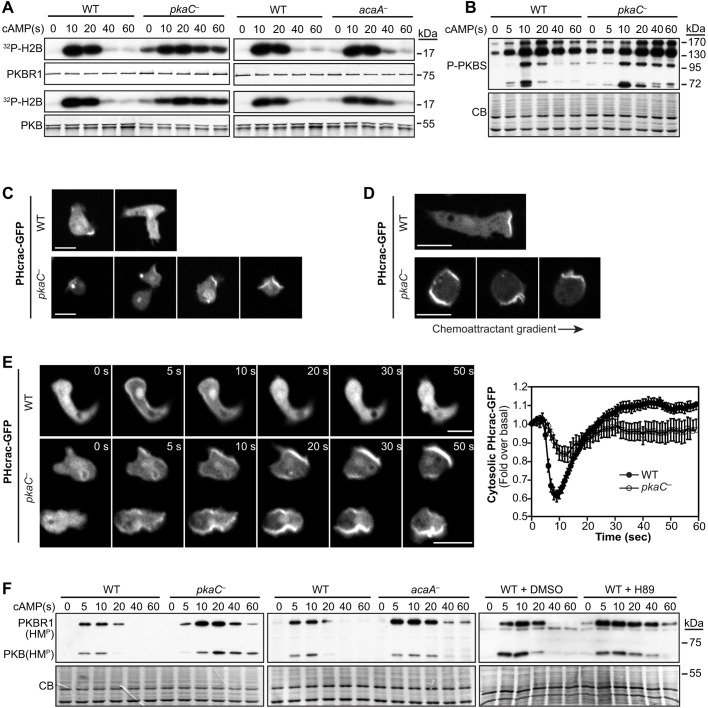
Activity of chemotactic effectors PKB, PKBR1, PI3K and TORC2 in cells lacking PKA function. (A) cAMP-induced PKB and PKBR1 kinase activity in wild-type (WT) and pkaC null (pkaC—) cells, and in cells lacking adenylyl cyclase A (acaA—). The kinase activity of immunopurified PKB and PKBR1 was assessed using H2B as a substrate. H2B phosphorylation was detected by autoradiography, and PKB and PKBR1 were revealed by immunoblotting. (B) cAMP-induced phosphorylation of PKB and PKBR1 substrates was detected using an antibody against PKB-phosphorylated substrates (P-PKBS). (C) Localization of the PI(3,4,5)P3 reporter PHcrac–GFP in developed resting cells. (D) Live imaging of PHcrac–GFP in cells exposed to an exponential gradient of cAMP. The direction of the gradient is indicated by the arrow. (E) Live imaging of PHcrac–GFP in cells that had been uniformly stimulated with 5 μM cAMP for the indicated times, and relative cytosolic fluorescence intensity of PHcrac–GFP measured in cells that had been uniformly stimulated with cAMP. Graph data represent the mean fluorescence intensity±s.e.m. of 20 WT and 26 pkaC null cells, expressed as a fold over the basal level. (F) TORC2-mediated phosphorylation of PKB and PKBR1 at their respective hydrophobic motifs (HMP) was assessed in WT, pkaC— and acaA— cells, and in WT cells treated with the PKA pharmacological inhibitor H89 or the vehicle (DMSO). CB, Coomassie blue staining. Scale bars: 10 μm. Data are representative of at least three independent experiments.

