Fig. 5.
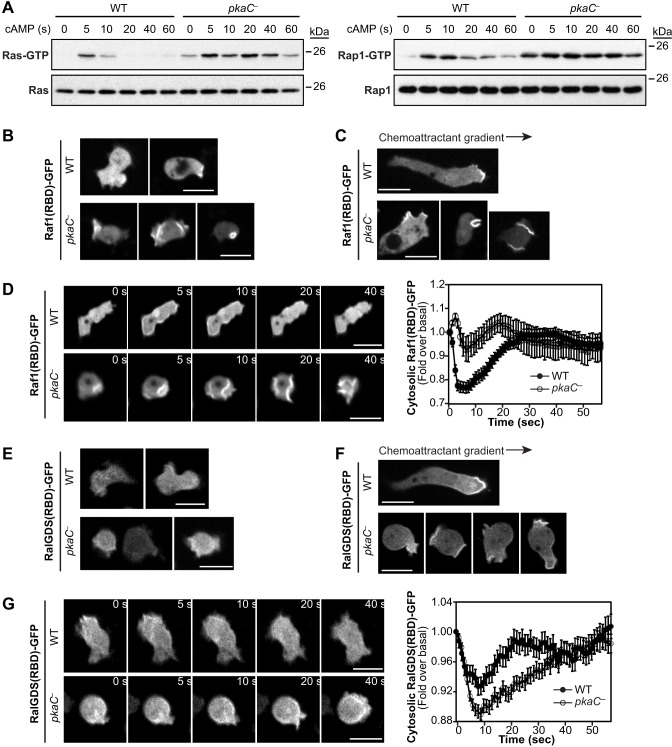
Spatiotemporal dynamics of RasG and Rap1 activities in pkaC null cells. (A) cAMP-induced RasG and Rap1 activation. Active RasG (Ras–GTP) and Rap1 (Rap1–GTP) were pulled down with GST–Raf1(RBD) and GST–RalGDS(RBD), respectively, and revealed by immunoblotting for pan-Ras and Rap1. (B,E) Localization of Raf1(RBD)–GFP (B) and RalGDS(RBD)–GFP (E) in resting cells. (C,F) Live imaging of Raf1(RBD)–GFP (C) and RalGDS(RBD)–GFP (F) in cells that had been exposed to an exponential gradient of cAMP. (D,G) Live imaging of Raf1(RBD)–GFP (D) and RalGDS(RBD)–GFP (G) in cells that had been uniformly stimulated with 5 μM cAMP for the indicated times. Relative reporter cytosolic fluorescence intensity is shown on the right, expressed as a fold over the basal level. Scale bars: 10 μm. Quantified data represent the mean fluorescence intensity±s.e.m. of 20 Raf1(RBD)–GFP-expressing WT cells, nine Raf1(RBD)–GFP-expressing pkaC null cells, 109 RalGDS(RBD)–GFP-expressing WT cells and 135 RalGDS(RBD)–GFP-expressing pkaC null cells. Data represent or are representative of at least three independent experiments.

