Fig. 7.
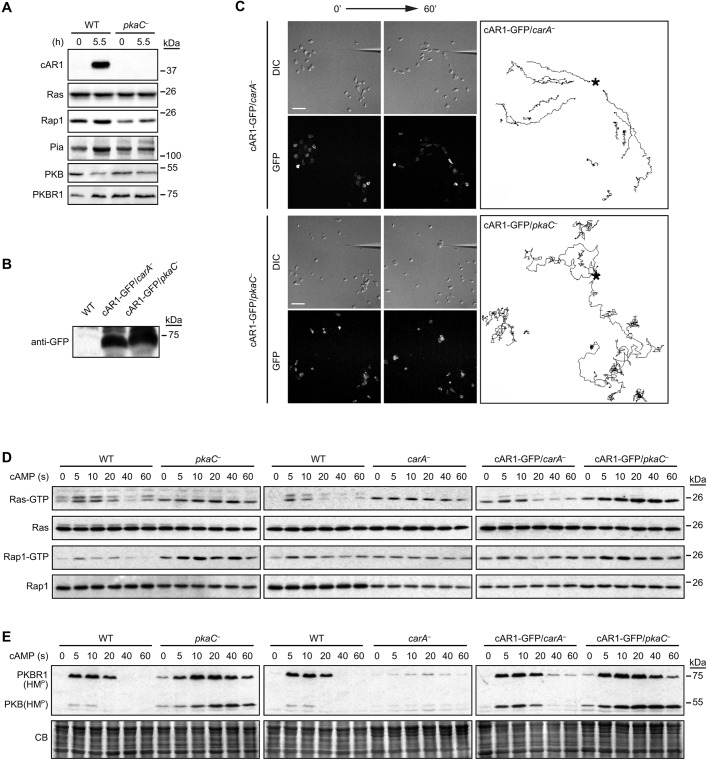
The expression of cAR1 and its role in RasG, Rap1 and TORC2 activation in pkaC null cells. (A) Expression of cAR1, Ras, Rap1, Pia, PKB and PKBR1 in wild-type (WT) and pkaC null (pkaC—) vegetative cells (0 h) and in cells pulsed with cAMP for 5.5 h, detected by immunoblotting using protein-specific antibodies. (B) cAR1–GFP expression in carA and pkaC null cells, revealed by GFP immunoblotting. (C) Chemotaxis phenotype of cAR1–GFP-expressing carA and pkaC null cells migrating in an exponential cAMP gradient created by a point source. Differential interference contrast (DIC) and fluorescence (GFP) images showing expressed cAR1–GFP are shown. (Right) Traces of the migration path for a subset of the migrating cells. *, position of the cAMP-filled micropipette. Scale bars: 50 μm. (D) cAMP-induced RasG and Rap1 activation. Active RasG (Ras–GTP) and Rap1 (Rap1–GTP) were pulled down with GST–Raf1(RBD) and GST–RalGDS(RBD), respectively, and revealed by immunoblotting for pan-Ras and Rap1. (E) cAMP-induced phosphorylation of the hydrophobic motif (HMP; TORC2 site) of PKB and PKBR1. CB, Coomassie Blue staining. Data are representative of at least three independent experiments.

