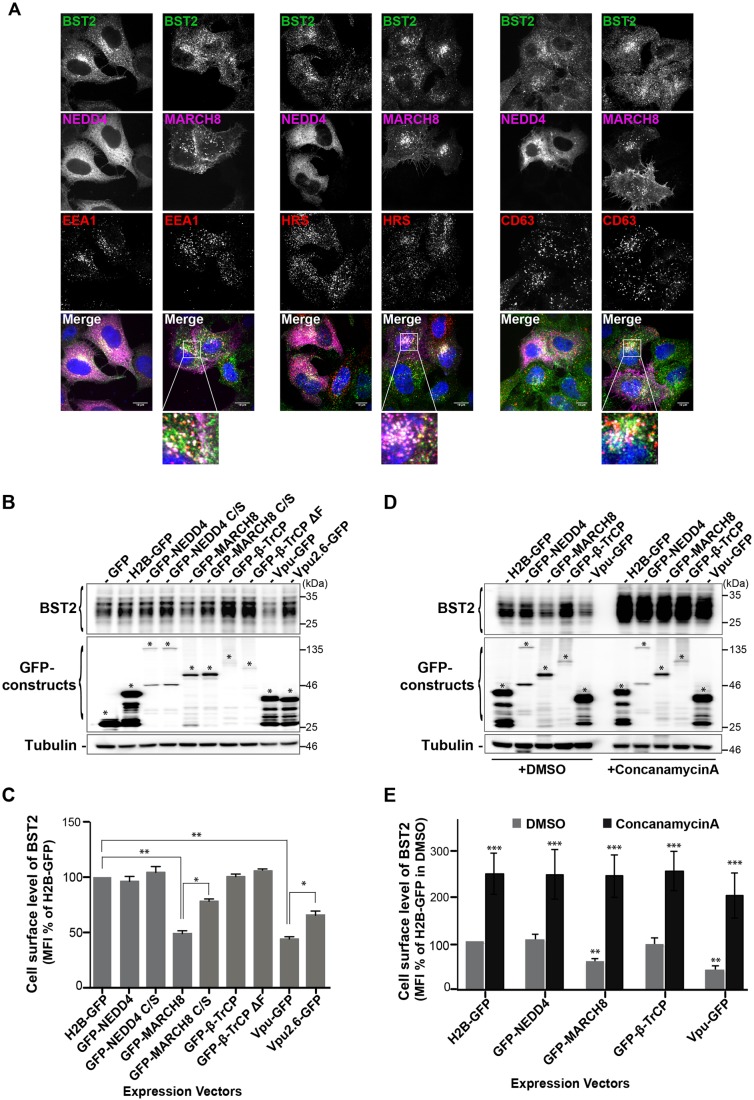
Fig. 6.
BST2 distribution in cells overexpressing NEDD4 or MARCH8. (A) HeLa cells that had been transfected with plasmids encoding GFP–NEDD4 or GFP–MARCH8 were permeabilized and co-stained with antibodies against BST2 (green) and EEA1, HRS or CD63 (red), along with DAPI (blue). Cells were then analyzed by confocal microscopy. Scale bars: 10 µm. Areas indicated in the square are magnified in the lower panels. (B) HeLa cells that had been transfected with the indicated expression vectors were lysed, and BST2 levels were assessed by western blot analyses. Tubulin is the loading control. Asterisks indicate the bands corresponding to GFP fusion proteins. These data are representative of three independent experiments. (C) HeLa cells that had been transfected with the indicated GFP fusion constructs were surface-stained with an antibody against BST2 or IgG1 isotype control and processed for flow cytometry analysis. The level of cell surface expression of BST2 was calculated as the mean fluorescence intensity (MFI) values obtained for BST2 staining minus MFI values of the isotype control. Values for each condition were normalized to those of control H2B–GFP expressing cells set as 100%. Bars represent the mean±s.d. (n=4); **P<0.01, *P<0.05 (Student's t-test). (D,E) HeLa cells expressing the indicated GFP fusion constructs for 12 h were further cultured for 16 h in the presence of either DMSO or 50 nM of Concanamycin A, an inhibitor of endosomal/lysosomal acidification, and processed for western blot and flow cytometry analyses as described in B,C. Bars represent the mean±s.d. (n=3); ***P<0.001, **P<0.01, *P<0.05 (Student's t-test).

