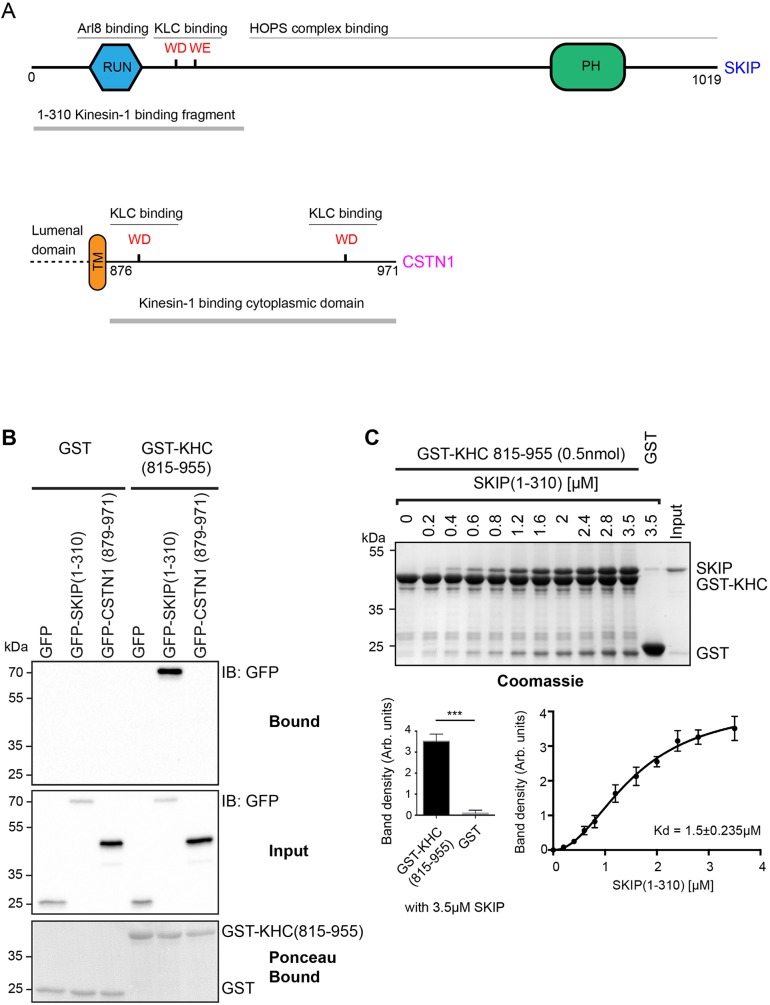
Fig. 1.
SKIP interacts directly with KHC. (A) Schematic showing domain organization of SKIP and CSTN1. (B) Western blot (IB) showing that GST–KHC(815-955) retains GFP–SKIP(1-310) from 293T cell extracts but not the cytoplasmic domain of CSTN1(879-971). Data are representative of three independent experiments. (C) Top: Coomassie-stained SDS-PAGE gel showing results from a GST pulldown experiment showing a direct interaction between GST–KHC(815-955) and SKIP(1-310). Bottom left: graph showing relative binding of SKIP(1-310) to GST and GST–KHC(815-955) at the 3.5 μM concentration shown in the top panel. Data is mean±s.e.m. of three independent experiments. ***P<0.001 (two-tailed t-test). Bottom right: graph showing quantification of SKIP(1-310) band density from three independent experiments as shown in the top panel. Error bars show ±s.e.m. Results are fitted to a one-site specific binding model with a hill slope [EQ Y=Bmax×Xh/(Kdh+Xh) where Bmax=4.23, Kd=1.53] (h)=2.04. R2=0.98.

